This is the archival website for the San Francisco Municipal Transportation Agency (SFMTA). It is not kept up to date. Please visit the SFMTA website for current information. parent page > Alternative Fuel Pilot Program | |||||||||||||||||||||||||||||||||||||||||||||||||||||||||||||||||||||||||||||||||||||||||||||||||||||||||||||||||||||||||||||||||||||||||||||||||||||||||||||||||||||||||||||||||||||||||||||||||||||||||||||||||||||||||||||||||||||||||||||||||||||||||||||||||||||||||||||||||||||||||||||||||||||||||||||||||||||||||||||||||||||
|
SAN FRANCISCO MUNICIPAL RAILWAY FLEET ENGINEERING ALTERNATIVE FUEL PILOT PROGRAMINITIAL 6 MONTH EVALUATION RESULTSfor 2 CNG 40-FOOT BUSES 2 HYBRID/ELECTRIC 40-FOOT BUSES 2 CLEAN DIESEL W/ PM FILTER 40-FOOT BUSES 2 CLEAN DIESEL CONTROL 40-FOOT BUSES
Working Draft May 2002
ABSTRACT The San Francisco Municipal Railway (Muni) is committed to reducing air pollution in San Francisco. One of the most significant ways that Muni helps to reduce pollution is to provide safe, reliable public transportation. With more people on transit, fewer cars on the road means less pollution. Muni also demonstrates its commitment to clean air by operating low-pollution vehicles. Fifty-three percent of Muni's active revenue fleet is pollution-free, including 203 rail vehicles and 332 electric trolley buses that generate zero pollution. Forty percent of Muni's buses are zero-emissions buses. Almost all of the electricity on which those vehicles run is generated by hydropower, a clean source of energy. Most of the diesel buses in Muni's fleet are new, and thus generate lower emissions. By December 31, 2002, the remainder of the diesel buses will be rebuilt with kits that reduce soot emissions. The diesel buses which have not been rebuilt will be retired from the active fleet. Muni operates 18 vehicles that are powered by compressed natural gas (CNG) in its non-revenue fleet. Muni is continuously seeking new ways to reduce pollution. Some of Muni's emissions-reduction programs were borne out of an agreement between the San Francisco County Transportation Authority (SFCTA) and Muni. In March 2001, the SFCTA attached a set of 11 conditions to TA Resolution 01-08, which authorized Muni's purchase of 95 diesel motor coaches. Those conditions are included in the Muni Bus Purchase Proposal, commonly referred to as the "11-Point Agreement." A copy of this agreement is included in Appendix A. The highlight of the 11-point agreement is this 6-month review of Muni's Alternative Fuels Pilot Program (AFPP). The AFPP is designed to allow Muni to identify the most appropriate low emissions bus technology to work within the constraints of San Francisco's unique terrain and duty cycle performance demands. Additionally, the program will allow Muni to identify associated facility support requirements. Data will be collected for 24 months on eight (8) buses representing four (4) categories of transit bus technology. This data will be examined to determine the impact of the various characteristics of each technology to Muni, such as performance, emissions, reliability factors, cost per mile, capital costs for the buses and facilities improvements, any safety concerns, and operator and passenger feedback. Results of similar studies may also be integrated in Muni's analysis and recommendations. This 6-month preliminary report and update will feature an overview and summary of the pilot project, with summary discussions and graphical data representation. Additionally, each data collection category will contain an evaluation procedure documenting the technical details related to the collection and analysis of the data gathered during the AFPP. Once the study is finished, Muni can then determine the viability and impact of each technology. These results will impact future bus procurements. The AFPP is designed to ensure that Muni will become experienced at adapting to and operating with the newest and least polluting bus technologies while posing the least risk to Muni's ability to meet service standards required by Proposition E. TABLE OF CONTENTS
INDEX OF TABLES
TABLE 1: AFPP VEHICLE SPECIFICATIONS TABLE 2: Exhaust Opacity Levels TABLE 3: Exterior Noise Level Summary (Graph) TABLE 4: Exterior Noise Level Overview (Graph) TABLE 5: Interior Noise Level Summary (Graph) TABLE 6: Interior Noise Level Overview (Graph) TABLE 7: Top Speed Summary (Graph) TABLE 8: Relative Top Speed (Graph) TABLE 9: Acceleration Times Summary (Graph) TABLE 10: Relative Acceleration (Graph) TABLE 11: Average Time Between Each Stop (Graph) TABLE 12: Average Total Trip Time Between Stops (Graph) TABLE 13: Fuel Economy TABLE 14: Vehicle Range TABLE 15: Driving Characteristics TABLE 16: Reliability Rates TABLE 17: Maintenance Survey - Relative Reliability Rates TABLE 18: Fuel Cost Per Mile TABLE 19: Maintenance Cost Per Mile TABLE 20: Total Cost Per Mile TABLE 21: New Bus Cost Summary TABLE 22: Infrastructure Requirements Comparison TABLE 23: Incremental Facility Costs Comparison EXECUTIVE SUMMARYThe Alternative Fuel Pilot Program (AFPP) has finished evaluating Compressed Natural Gas (CNG), Hybrid, and exhaust after-treatment (PM filter) vehicle technologies during the initial six months in revenue service at Muni. This program was designed to provide recommendations regarding future Muni motor coach procurements. San Francisco's unique and challenging transit environment, featuring the City's famous hills, commitment to "transit first" principles, and potential for emergency service requirements in the event of another earthquake, requires a site-specific evaluation of alternative transit technologies. The test buses were compared to unmodified conventional diesel buses in 19 different categories. These categories are grouped into the general areas of: EMISSIONS; PERFORMANCE; OPERATIONS; MAINTENANCE; COST; and SAFETY CONCERNS.
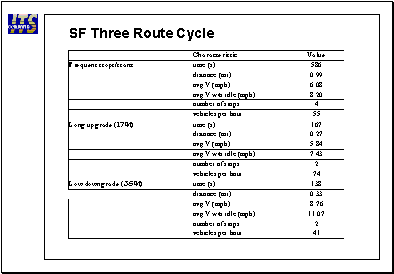
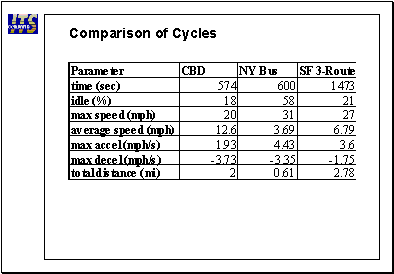
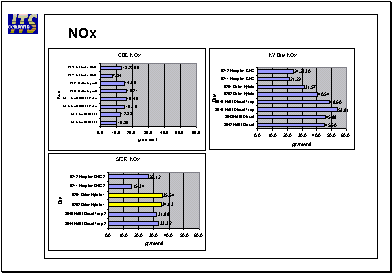
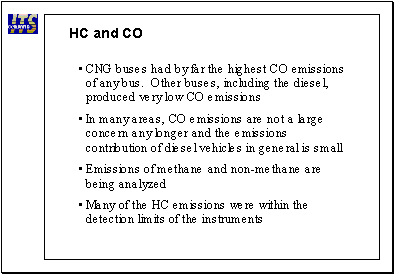
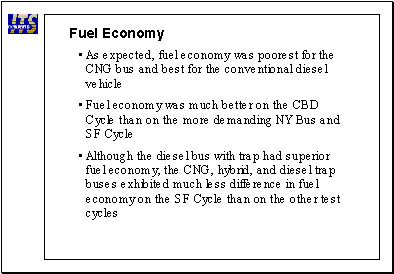
The University of California at Davis - Institute of Transportation Studies (ITS) was contracted by Muni to compare the emissions and energy efficiency of the different AFPP technologies. This comparison was primarily made with a chassis dynamometer[1] using an ITS-designed San Francisco simulation which, for the first time, tested heavy duty vehicle emissions on hills. Results of this testing are found in the UC Davis-ITS Preliminary Chassis Dynamometer Test Results for Four Types of Advanced Technology Buses presentation, attached at Appendix C. The detailed UC Davis-ITS Preliminary Chassis Dynamometer Test Results for Four Types of Advanced Technology Buses Report will be available from UC Davis through Muni fleet engineering on June 1, 2002. ITS and Muni evaluated CNG, hybrid, and exhaust particulate (PM) filter vehicle technologies during their initial six months in revenue service. San Francisco's unique and challenging transit environment, including the City's famous hills, and commitment to "transit-first" principles required an on-sight evaluation as well as "laboratory" testing on the chassis dynamometer. The test buses were compared to unmodified conventional diesel buses in 19 different categories. These categories are further grouped below into the general areas of: emissions; performance; operations; maintenance; cost; and safety concerns. Emissions Tailpipe emissions Researchers at the Institute of Transportation Studies, University of California Davis analyzed the Phase One emissions testing which took place over a period of 6 months. Eighteen months of testing will continue until the full program concludes, in July 2003. ITS-Davis staff explained that testing of advanced technology buses is a complex and evolving science. The tests conducted for Muni thus far were intended to 1) confirm that results were consistent with those reported by other advanced bus technology testing programs and 2) facilitate development of new tests suited to San Francisco's unique terrain and driving conditions. With these caveats, UC Davis offered the following preliminary results of based on the standard emissions tests: a) the magnitude of emissions were generally consistent with those found in other studies of advanced technology buses operating, b) as is typical of emissions testing, there was a large range of emissions values for each bus, c) the hybrid, CNG, and diesel buses with traps offered greatly reduced PM emissions compared to conventional diesel buses, d) PM emission of CNG, hybrid, and diesel bus with trap were similar and sometimes at the detectable limits of the analyzers, e) the CNG buses demonstrated the lowest NOx emissions followed by the hybrid and diesel buses, f) CNG buses had the highest CO emissions of any bus, g) the diesel buses exhibited the best fuel economy and the CNG bus the poorest. Unlike other testing, the hybrid bus had poorer fuel economy than the diesel. This can be attributed to the diesel's unexpectedly high fuel economy. However, these results may not be indicative of the in-use emissions in San Francisco. San Francisco's unique grade and operations characteristics (such as average speed and idling duration) are not captured in the traditional test cycles discussed above. ITS-Davis created a preliminary SF specific test cycle using bus speed and road grade information collected on three diverse Muni routes. Limited testing on the SF Cycle indicates that the fuel economy differences between buses may be less in SF than predicted by the conventional cycles. There were several test protocol difficulties that need to be addressed with California Truck Testing Services, the contracted emissions testing facility, prior to the next round of testing. Diesel bus emissions and fuel economy in particular were inconsistent, and there were difficulties with hybrid bus testing. The testing that was conducted in the first six months of Phase One is insufficient for staff to recommend one type of alternative fuel over another. The staff of ITS-Davis agrees that more testing is required over the remaining 18 months of the pilot program, in order to achieve more meaningful results. ITS-Davis recommends that they actively participate in the data collection and emissions testing in this next phase. Comprehensive bus operations and topography data collection could commence in July 2002, and the next round of emissions testing would occur in October 2002. Visual quality of exhaust Vehicle exhaust odor was not noticeable by passengers on any of the AFPP buses. Exhaust opacity, or visual quality, was outstanding on all of the technologies. Vehicle noise levels Exterior noise was significantly lower on the Hybrids. In general, interior noise was lowest on the Hybrids and CNG buses. PM filters lowered the interior and exterior noise levels of the conventional diesels. Performance Performance indicators included top speed and acceleration on different grades, average time between stops, fuel economy, and fuel range. Grades of up to 21% were used in these performance evaluations.[2] The following performance indicators were observed: 1) Hybrid buses accelerated faster than any of the other technologies, regardless of grade. In general, the PM filter buses have the best top speed performance on all grades, followed by the CNG buses. Preliminary results indicate that PM filters did not degrade the performance of conventional diesel buses. 2) In challenging operating conditions hybrids gained time on each line trip, while the CNG buses lost time compared to the diesel buses.[3] 3) The PM filter buses have the best fuel economy and range. The CNG buses are the least fuel efficient, and hybrid buses have the shortest fuel range.[4],[5] Operations Both operators and passengers were surveyed informally for their opinions regarding the alternative technologies. 1) Operators of the AFPP buses preferred the PM filter buses. However, hybrids were said to be smoother while performing just as well. Both CNG and hybrid buses were said to have better braking. In general, operators did not feel that CNG buses were well-suited for hills or high passenger loads. 2) Riders want dependable service first and foremost, but would prefer to ride clean-fuel buses whenever possible. Riders are generally concerned with all kinds of emissions, but don't view Muni as a major source of pollution. Most riders feel that a different fuel source probably means a cleaner burning engine.[6] Maintenance Muni moves the equivalent of San Francisco's entire population every day. Vehicle reliability is crucial. 1) During their initial 6 months in operation, the PM filter buses were four (4) times more reliable than CNG buses, and 10 times more reliable than the hybrids.[7] The PM filter buses accumulated more than three (3) times the mileage during their first 6 months compared to the CNG and hybrid buses, partly due to the relatively low reliability rates found so far in the alternative technologies. Six months is not a sufficient time period in which to test reliability. 2) Mechanics working on the AFPP felt that many maintenance issues could be resolved as their knowledge of the new technology improved. Cost Ongoing operational costs and onetime capital costs were analyzed. Operational costs include fuel[8] and technology-specific maintenance.[9] For the purposes of this report both are calculated in terms of cost per mile. Capital costs include the incremental cost of the vehicles and necessary fueling and facility modifications. 1) Fuel only cost per mile is highest for the CNG buses, and lowest for the PM filter buses. Technology-specific maintenance costs were also highest for the CNG buses and significantly lowest for the PM filter buses. Combining fuel and maintenance costs produce the same results. 2) Muni conventional diesel buses with PM filters cost approximately $330,000.[10] Hybrids currently cost about $120-170,000 more per bus than a Muni diesel bus with PM trap. CNG buses cost approximately $45-60,000 more per bus than Muni diesel buses with PM traps. In order to meet CARB emissions standards in 2004, diesel buses must be equipped with aftertreatment technology that will reduce NOx. The aftertreatment technology that Muni will be testing (EGR) costs approximately $10,000 for each bus.[11] The cost of CNG buses has dropped as more buses are being manufactured. An order of 15 hybrid buses would cost approximately $450-500,000 at this time. However, the price is expected to decline as the technology gains popularity.[12] Currently, there are 34 hybrid buses in operation in the United States. In the state of California, eight (8) are in operation, including the two (2) that Muni owns. In January 2002, Muni requested a federal earmark of $1.5 million for the purchase of alternative fuel buses in the FY03 Congressional appropriations process. Two other sources of funding are the Program Manager and Regional Funds from the Transportation Fund for Clean Air. Any public agency can apply for funds from these sources. The Program Manager fund contains approximately $950,000. Muni received $500,000 from this fund in FY02 for CNG facilities. Regional funds total approximately $8 million, but individual annual grants cannot exceed $1 million. Muni will be submitting an application for funding from the Regional account in May/June 2002.[13] 3) None of Muni's current facilities are safety compliant with CNG buses. Fueling and maintenance facilities must be specifically tailored for CNG. To support a fleet larger than 15 CNG buses, Muni would need to spend roughly $7 million for capital costs associated with one facility. For additional capacity, the cost to Muni would be an additional $5 million, bringing the total cost to $12 million for capital costs associated with modifications to two facilities. It is noted, however, that one facility could provide enough capacity for a large purchase of CNG buses. Capital costs associated with facility modifications for a large purchase of hybrid buses would be about $1.05 million. Safety The safety category is primarily concerned with the hazards of CNG vehicle operation on bridges, through tunnels, under electric trolley contact wires, and inside terminals. Secondary concerns include threats from intentional harm, and earthquake conditions. HazardsIn general, the hazard potential from CNG buses during operation is extremely low. However, it is strongly recommended that certain areas be evaluated further. Other areas include streets with low trolley wires, where the possibility of an explosion exists in which an errant wire may strike a CNG tank on the top of a passing bus.[14] Hazards in long tunnels such as Broadway and Stockton present other areas for further evaluation, and should be avoided in the meantime. A comprehensive safety evaluation and certification must be in place before the procurement of CNG buses or modification of facilities. Terrorism Muni buses operate around City Hall, the Federal Building, the United Nations plaza, the TransAmerica Building, and on the Golden Gate Bridge, which may be considered terrorist targets for various reasons. Given the volatility of CNG relative to diesel fuel, CNG buses could be considered a target for terrorism.[15] Earthquakes The US Geological Survey states that there is a 67% probability that San Francisco will one day experience another Richter-magnitude 7 earthquake. During the 1989 Loma Prieta earthquake, electricity and natural gas supplies were unreliable in San Francisco. Fifty-three percent of Muni's entire fleet is currently electric powered. In the event of an emergency, with gas and electric supplies cut or reduced, a reliable fuel source will be crucial. The Independent Oversight Committee (IOC) has suggested that the use of liquefied natural gas (LNG) would obviate the risk of service interruption in the event of an earthquake. San Francisco's solid waste hauler, NorCal Waste Systems is in the process of converting its fleet to LNG. Summary The preliminary results of the AFPP indicate that Muni should continue its testing program. The past six months of testing has yielded preliminary, and not reliable, emissions results.[16] Muni may also consider the testing of new technologies, such as LNG, the use of oxidation catalysts, and other aftertreatments in Phase Two of testing. Muni should also consider the impact of regulations on its future procurements. California is mandating new emissions standards in 2004-2006. Even more stringent regulations will be imposed in 2007 by the federal Environmental Protection Agency. Natural gas buses do meet the 2004 CARB mandate. Currently, neither conventional nor hybrid diesel buses meet the 2004 mandate although aftertreatment technology and new hybrid certification standards may enable diesel buses to meet the new standards. Diesel, hybrid, and CNG currently do not meet 2007 standards.
INTRODUCTIONBACKGROUNDThe mission of the Alternative Fuel Pilot Program (AFPP) is to objectively evaluate alternative fuel technologies so that Muni can make an informed decision when considering propulsion technologies for future vehicle procurements. This program is designed to determine what additional considerations must be addressed as well as considering which alternative fuel technology is most appropriate for use in San Francisco's unique transit environment. The AFPP will last for a total of 24 months. An Independent Oversight Committee, headed by personnel from the City and County of San Francisco Clean Cities Program, acts in the interest of the many citizen groups and environmental organizations that worked to develop the fundamentals of the AFPP. Preliminary and final recommendations developed by Muni, as well as contingency plans if testing or project scheduling falls behind, will be addressed by this oversight committee. Should results from similar studies (performed by other transit agencies) be incorporated into Muni's analysis, these studies will be current and evaluated for appropriateness by the Independent Oversight Committee (IOC) prior to inclusion.[17] PROGRAM MISSION The goal of this program is to objectively evaluate the performance, reliability, emissions, safety, operating and capital costs of compressed natural gas (CNG) bus, hybrid bus, and exhaust particulate matter (PM) filter bus technologies. These technologies will be evaluated for 24 months, using conventional diesel buses as a control/base measurement. PROGRAM OBJECTIVES The program is set up using the following guidelines: Evaluations of new, alternative technology will provide San Francisco specific information so as to lay the foundation for future vehicle procurements.[18] Alternative technologies being evaluated include: two (2) CNG buses, two (2) hybrid buses, two (2) exhaust PM filter technology clean-diesel buses, and two (2) conventional clean-diesel control group buses. Evaluations of supplemental emissions technology will provide information on the impact of adding California Air Resources Board (CARB) mandated PM filters to clean-diesel buses in the fleet so that they too will exhibit dramatically reduced emissions. Note that Muni is going ahead with this retrofit on the entire clean-diesel fleet four (4) years ahead of CARB's schedule. Fleet engineering will produce periodic and quarterly reports, as well as project summaries/recommendations after six (6) months, 12 months, and after 24 months of testing. APPROACH The eight (8) AFPP buses are stored and operated out of Muni's Kirkland and Woods divisions, and maintained at Muni's Marin Street division. The diesel buses are fueled at Kirkland and Woods, while the CNG buses are fueled at an off-site CNG station.[19] Three (3) maintenance personnel and up to 50 operators have been specifically trained on the AFPP buses, as well as in the record keeping techniques required for the testing. DATA COLLECTION Tailpipe emission data Exhaust odor Exhaust opacity Interior noise levels Exterior noise levels Acceleration performance on grades Top speed performance on grades 20-Hour performance Total operational trip time and average time between stops Fuel economy Fuel range Operator feedback Passenger feedback Maintenance feedback Reliability rate Capital costs Operating costs Facility compliance Safety concerns
TABLE 1 AFPP VEHICLE SPECIFICATIONS
EMISSIONSTailpipe Emissions Exhaust Odor Exhaust Opacity Vehicle Noise Levels TAILPIPE EMISSIONSCategory leader: San Francisco specific results were inconclusive. SUMMARY The University of California at Davis - Institute of Transportation Studies (ITS) was contracted by Muni to compare the emissions and energy efficiency of the different AFPP technologies.
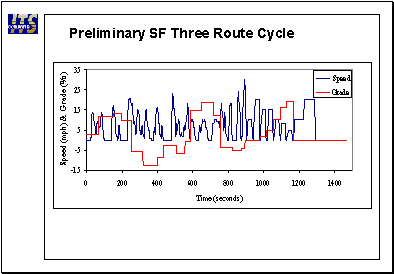
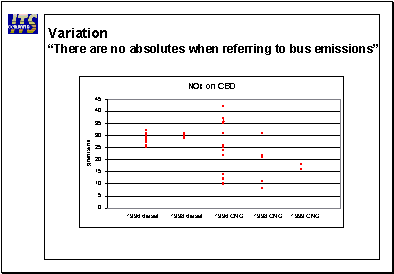
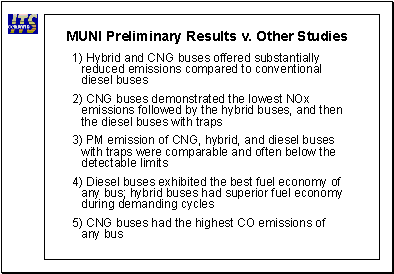
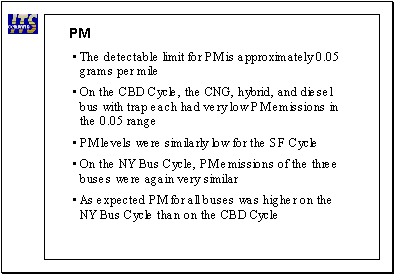
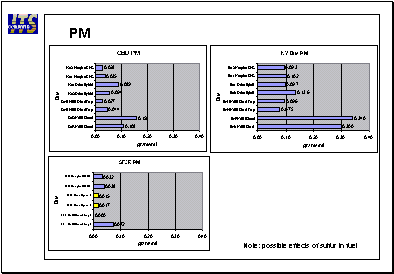
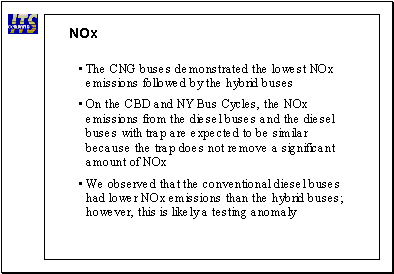
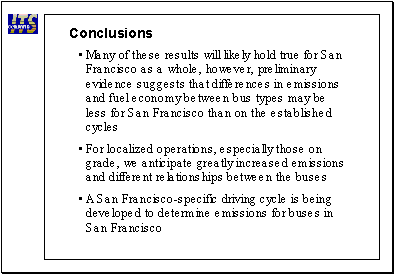
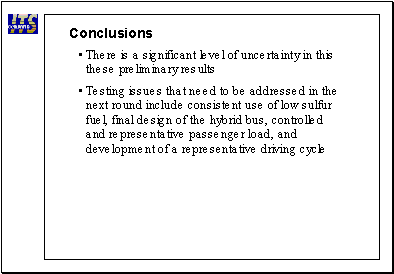
ITS-Davis staff and Muni evaluated CNG, hybrid, and PM filter vehicle technologies during their initial six months in revenue service. This comparison was primarily made with a chassis dynamometer[21] using an ITS-designed San Francisco simulation which, for the first time ever, tested heavy duty vehicle emissions on hills. Researchers at the ITS-Davis oversaw Phase One emissions testing over a period of 6 months. Eighteen months of testing will continue until the full program concludes, in July 2003. ITS-Davis staff explained that testing of advanced technology buses is a complex and evolving science. The tests conducted for Muni thus far were intended to 1) confirm that results were consistent with those reported by other advanced bus technology testing programs and 2) facilitate development of new tests suited to San Francisco's unique terrain and driving conditions. With these caveats, UC Davis offered the following preliminary results based on the standard emissions tests: a) the magnitude of emissions were consistent with those found in studies of advanced technology buses operating, b) as is typical of emissions testing, there was a large range of emissions values for each bus, c) the hybrid, CNG, and diesel buses with traps offered greatly reduced PM emissions compared to conventional diesel buses,[22] d) PM emission of CNG, hybrid, and diesel bus with trap were similar and sometimes at the detectable limits of the analyzers, e) the CNG buses demonstrated the lowest NOx emissions followed by the hybrid and diesel buses,[23] f) CNG buses had the highest CO emissions of any bus,[24] g) the diesel buses exhibited the best fuel economy and the CNG bus the poorest. Unlike other testing, the hybrid bus had poorer fuel economy than the diesel. This can be attributed to the diesel's unexpectedly high fuel economy. However, these results may not be indicative of the in-use emissions in San Francisco. San Francisco's unique grade and operations characteristics (such as average speed and idling duration) are not captured in the traditional test cycles discussed above. ITS-Davis created a preliminary SF specific test cycle using bus speed and road grade information collected on three diverse Muni routes. Limited testing on the SF Cycle indicates that the differences between buses may be less in SF than predicted by the conventional cycles. Other lessons learned: There were several test protocol difficulties that need to be addressed with California Truck Testing Services (CaTTS), the contracted emissions testing facility, prior to the next round of testing. The testing that was conducted in the first six months of Phase One is insufficient for staff to recommend one type of alternative fuel over another. The staff of ITS-Davis agrees that more testing is required over the remaining 18 months of the pilot program, in order to achieve more meaningful results. ITS-Davis recommends that they actively participate in the data collection and emissions testing in this next phase. Comprehensive bus operations and topography data collection could commence in July 2002, and the next round of emissions testing would occur in October 2002.
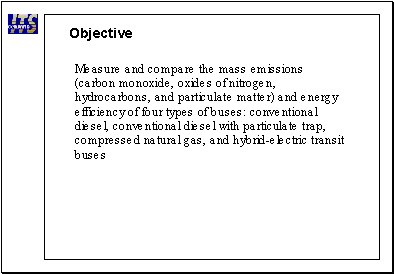
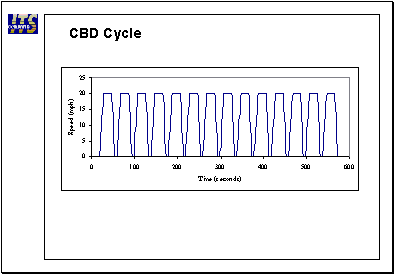
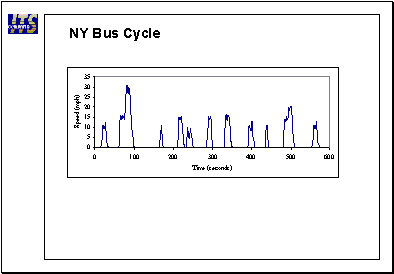
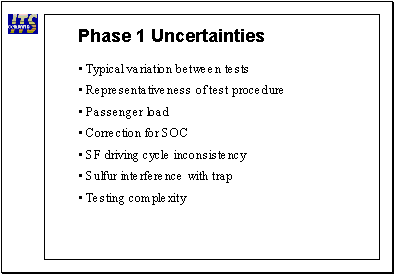
Next steps: Comprehensive bus operations and topography data collection could commence in July 2002, and the next round of emissions testing would occur in October 2002. If possible, on-road emissions testing should be used to collect data in addition to chassis dynamometer data. RESULTS Results of this testing are found in the UC Davis-ITS Preliminary Chassis Dynamometer Test Results for Four Types of Advanced Technology Buses presentation, attached at Appendix C. The detailed UC Davis-ITS Preliminary Chassis Dynamometer Test Results for Four Types of Advanced Technology Buses Report will be available from UC Davis through Muni fleet engineering on June 1, 2002. The objective of ITS-Davis was to measure and compare the mass emissions (carbon monoxide, oxides of nitrogen, hydrocarbons, and particulate matter) and energy efficiency of AFPP buses. Specific tasks handled by UC Davis included: Managing chassis dynamometer-based testing. Oversight of emission testing using conventional driving cycle test protocols: the Central Business District (CBD) and New York Bus (NY Bus) Cycles, which have been used extensively in previous research.[25] Comparison of the emission test results to those from other large advanced technology bus testing projects. To design a San Francisco specific test, conduct preliminary testing on this cycle, and compare the results of this cycle to the results from other cycles. Phase 1 Uncertainties: Typical variation between tests Representativeness of test procedure Passenger load Correction for State of Charge[26] SF driving cycle inconsistency Sulfur interference with trap Testing complexity EXHAUST ODORCategory leader: Inconclusive due to confusing survey questionnaire.
SUMMARY Passengers were surveyed for their opinions regarding each technology's exhaust odor as part of the passenger survey. This is a quality of life issue similar to exhaust opacity. Results from this survey question are inconclusive. In general, none of the technologies seems to have a noticeable exhaust odor. Next steps: The exhaust odor question should be refined further, and the survey re-administered to a larger sample of passengers. RESULTSInconclusive. According to the preliminary survey designer and administrator the survey language must be revised: "People who think I'm asking 'can you tell right now' say NO. People who think I'm asking 'could you tell if you put your nose up to (the exhaust)' say YES. The question needs to get better so we can see if we are measuring actual perception, or mental perception."[27] EVALUATION CRITERIA 1. EXHAUST ODOR 1.1. Evaluation: Data is collected for each alternative bus technology and a qualitative comparison is made using the Muni's conventional clean-diesel bus fleet as the standard. Passenger feedback surveys are primarily used to evaluate exhaust odor. 1.2. Test Procedure: The surveys are verbally given to passengers while the test bus is in revenue service. Surveys shall be given to a large number of passengers in order to better represent public opinion. 1.3. Significant Variables: 1.3.1. Language: The survey is given in English only, which may prevent many Muni riders from providing feedback. 1.3.2. Runs: The survey is only given on a specific runs only; the survey is only given in certain parts of the city at certain times of the day. 1.4. Test Personnel: Test personnel who are clearly identified as being employed by Muni administer the surveys. EXHAUST OPACITYCategory leader: All.SUMMARYExhaust opacity is a method of evaluating the visual appeal of a vehicle's exhaust. This is a quality of life indicator similar to exhaust odor. Although quantified opacity results differ slightly between each technology pair, the difference between the highest and lowest measured exhaust opacity levels on the test buses is insignificant. None of the test buses produce visible exhaust smoke under normal operating conditions and the hybrid's exhaust opacity could not be measured. Other lessons learned: As anticipated, adding a PM filter to a conventional diesel engine lowered the exhaust opacity. However, due to Muni's recent conversion to ultra low sulfur diesel (ULSD) fuel,[28] the PM filters in the test program may not be performing to maximum potential with the new fuel. This because the relatively high sulfur content of the previous fuel tends to partially plug the filter for a period of time. Once properly cleaned and combined with dedicated use of ULSD, greater opacity reductions are predicted for the diesel powered buses with PM filters (conventional diesel and hybrid). Next steps: Since the exhaust gas tester could not measure hybrid exhaust opacity, data should be recollected in order to verify actual levels. Exhaust particulate filters should all be properly serviced and cleaned by the manufacturers prior to retesting.[29] RESULTSRelatively high exhaust opacity levels are an indication of darker exhaust smoke. The control group conventional diesel buses have the highest exhaust opacity. The hybrid bus exhaust opacity is apparently so low that it could not be measured with Muni's opacity measurement equipment.[30] The CNG buses and PM filter equipped diesel buses fall in between the control group diesels and the hybrids. Overall average levels range from 2.6% to less than 1%[31] TABLE 2 EXHAUST OPACITY LEVELS:
EVALUATION CRITERIA2. TAILPIPE EXHAUST OPACITY 2.1. Evaluation: Data is collected for each bus technology pair and a relative comparison is made using the unmodified diesel bus pair as the standard. The average percent opacity for each technology type determines the final result for that pair. 2.2. Definitions: The visual quality of a vehicle's tailpipe exhaust is measured by a smokemeter in units of percent visual opacity. 2.2.1. Zero percent (0%) opacity defines clear. 100% opacity defines black. 2.3. Test Procedure: 2.3.1. Prior to Testing: Warm up and calibrate opacimeter. 2.3.2. Measurement: Snap accelerate the engine for three (3) seconds, maintain engine speed for the following two (2) seconds, return the engine to idle speed. Repeat five (5) times. 2.3.3. Final result: The average of five (5) opacity reading determines the final result for that vehicle. 2.4. Vehicle Conditions: 2.4.1. Operating Temperature: Test engine should be allowed to reach operating temperature prior to testing. For purposes of this test, operating temperature has been reached if engine oil temperature is 140 F or above. 2.4.2. Engine Inspection: There are no exhaust leaks or misadjusted engine settings. 2.5. Data Collection Equipment: An exhaust gas tester is used to analyze the content of black, white and blue exhaust smoke from the test engines. VEHICLE NOISE LEVELSCategory leader: Hybrid.
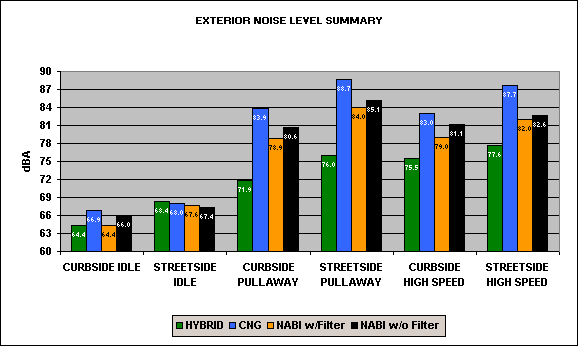
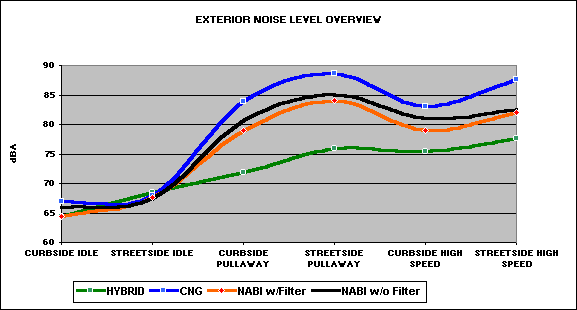
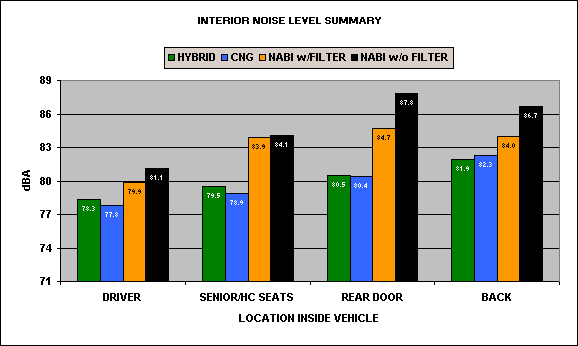
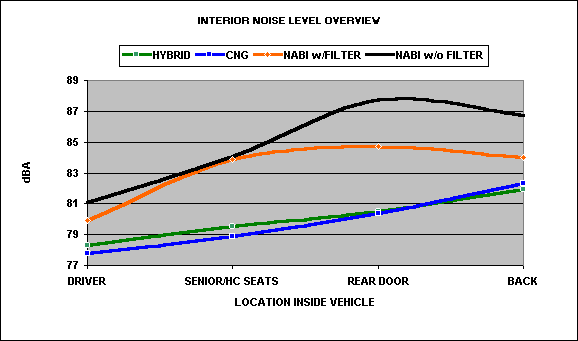
SUMMARY There are two sub-categories for vehicle noise in this evaluation: Exterior noise and interior noise. An average of the two highest noise levels measured in each category are represented in these results. Exterior noise levels are lowest on the hybrids, and highest on the CNG buses. Interior noise levels are lowest on the CNG and hybrid buses, and highest on the conventional diesel buses. Some of the results are misleading. For example, when the CNG buses are in service, the exterior noise levels are not offensive. Similarly, the measurably low interior noise levels found on the hybrid buses are misleading. Qualitatively, the interior noise levels for passengers in the very rear of the hybrids are unacceptably loud. The exterior noise levels of the CNG buses, and the interior noise levels of the hybrids can be significantly reduced in future purchases through cooling system and noise insulation modifications. However, it is unlikely that any of the other technologies will be able to match the low exterior noise levels produced by the hybrid buses due to the nature of the technology and layout differences between hybrid technology and conventional bus technology.[32] Other lessons learned: Adding PM filters to the conventional diesel buses appears to decrease both interior and exterior noise levels. Next steps: Noise level data should be collected while the vehicles are in service in order to supplement data taken under controlled, extreme test conditions. RESULTSTABLE 3
TABLE 4
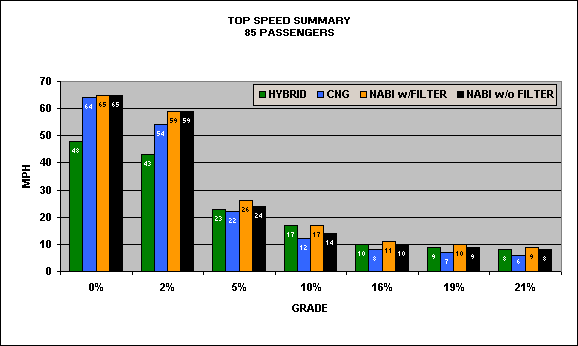
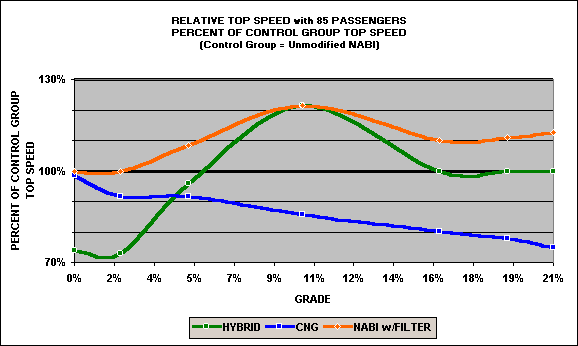
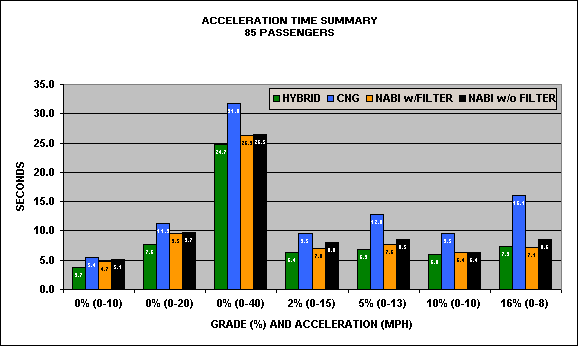
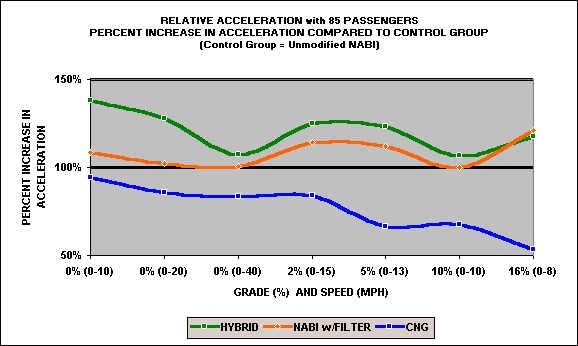
TABLE 5 TABLE 6 Exterior noise levels for each technology differed significantly. In general, the hybrid buses produce the least amount of noise, and the CNG buses produce the most exterior noise. The conventional diesel buses fall in between the alternative technologies when it comes to exterior noise, and they are louder than the alternative technologies inside. The exterior noise level results for the CNG buses are not as representative of actual operating conditions as the results for the other test buses. In this case, test conditions require the engine's cooling fan to operate continuously, yet in service the CNG engine cooling fan rarely engages. Interior noise is clearly split between conventional technology and alternative technology. The CNG and Hybrid buses are considerably quieter for passengers and operator than the conventional diesel buses. Differences in vehicle noise, both interior and exterior, can be greatly influenced by vehicle specifications. For example, interior noise was greatly raised by the ventilation system on the NABI diesel buses. EVALUATION CRITERIA 3. NOISE EMISSIONS 3.1. Evaluation: 3.1.1. Technology: Data is collected for each bus technology pair and a relative comparison is made using the unmodified diesel bus pair as the standard. The highest overall set of vehicle values for each technology type determines the final results. 3.1.2. Vehicle: For each vehicle, at least three (3) readings are taken for each specific measurement. The two (2) highest readings for each measurement location or condition, within one (1) dBA of each other, are averaged to determine the final noise result for each measurement. For example, if the curbside idle readings are 67.6 dBA, 67.8 dBA, and 68.0 dBA, then the final result will be 67.9 dBA. Three (3) significant figures are used to express the final result of all subsets. 3.2. Definitions: 3.2.1. Set is defined here as all of the results for a single vehicle in each main noise category: interior and exterior. 3.2.2. Subset is defined here as a singe category within the main categories of internal and external noise. For example, noise level results for the driver's area is a subset of interior noise levels. 3.3. Test Procedure: 3.3.1. Exterior Noise: Exterior noise levels are measured on both vehicle curbside and vehicle street side.[33] The three (3) categories measured are: Idle; pull-away; and pass-by. Society of Automotive Engineers (SAE) J366 FEB87 Exterior Sound Level for Trucks and Buses measurement procedure is followed. In reference to J366 FEB87 section 4.3.3: The sound level for each side of the vehicle shall be the average of the (2) two highest readings within (1) dBA of each other, rather than within (2) dB of each other. 3.3.2. Interior Noise: Interior noise levels are measured at four (4) points in the vehicle: At the driver area, at the very front seats, at the rear doors, and at the very rear of the vehicle. All readings are taken at seated head level. All readings are taken in the middle of the passenger isle, except for the driver area reading. The driver area reading is taken at head level directly above the operator's seat cushion. The sound level meter microphone is pointed toward the front of the vehicle during all readings. Readings are collected as the vehicles are accelerated from zero (0) to 30 mph. The same city street is used for all measurements. 3.4. Site Conditions: 3.4.1. Ambient Noise: All data is collected in dry weather and still wind conditions. 3.5. Vehicle Conditions: 3.5.1. Fans: Engine cooling fans are configured to provide maximum cooling at all times during testing. For interior noise testing, all interior fans and heaters are set to provide maximum output. 3.5.2. Chassis: All windows, hatches, and doors are closed. 3.5.3. Passengers: The vehicle is empty with the exception of test personnel (3.8) and equipment (3.7). 3.6. Significant Variables: Every effort is made to eliminate data that may be influenced by an intermittent ambient noise. If such a noise occurs, it will void the measurement. Examples of random ambient noise are: Extremely loud street conditions, a plane flying overhead, or a car horn. 3.7. Data Collection Equipment: An SAE J366 approved digital sound level meter is used to determine vehicle noise levels. 3.7.1. Settings: Sound meter is set to the "A" scale, fast response. Meter reading units are decibels (dB), with a resolution of one-tenth of a dB. The meter's hold feature is used to determine maximum readings.[34] Every effort is made to disregard readings which may be the result of a sudden ambient noise condition (3.6). This may cause the meter's hold feature to display the result of the ambient noise spike. 3.7.2. Repeatability: The same sound meter is used for all vehicles. Sound meter is self-calibrating. Sound meter calibration is verified with an external sound meter calibration device. 3.8. Test Personnel: Personnel consist of one (1) driver and one (1) data collector. The data collector witnesses the test equipment readings and records test results. 3.8.1. Driver: The test driver is given simple, consistent verbal and visual commands. Upon seeing the command to accelerate, the driver will press the throttle pedal immediately to the floor. The throttle shall remain fully depressed throughout the acceleration run. Every effort is made to eliminate performance variation caused by different driving styles PERFORMANCEAcceleration and Top Speed Operation Times Fuel Economy Range ACCELERATION AND TOP SPEEDCategory leader: Conventional diesel. Alternative leader: Hybrid. SUMMARY Test buses carrying the equivalent of 85 passengers were tested for top speed and acceleration on 0-21% grades. The conventional diesel buses have relatively superior top speed performance regardless of grade. As grade increases, the top speed performance of the hybrid buses improves, while the top speed performance of the CNG buses decreases. The hybrid buses accelerate faster than any of the other technologies on every grade, with the exception of the 16% grade[35] where they were nearly identical with the acceleration rate of the diesel buses equipped with PM filters. CNG buses accelerate at a slower rate than the other test buses in every category.[36] Overall, the hybrid buses are ideally configured for hill climbing and acceleration. The CNG buses are well suited for level ground, high-speed applications. The conventional diesel buses perform well in all operating conditions, providing operating flexibility. Other lessons learned: Adding PM filters to conventional diesel buses seemed to generally improved both top speed and acceleration. Next steps: Future procurements should specify certain performance goals based on the results of this testing, since performance can be greatly influenced by vehicle specifications. RESULTS TABLE 7 TABLE 8 TABLE 9 TABLE 10 EVALUATION CRITERIA 4. PERFORMANCE 4.1. Evaluation: Data is collected for each bus technology pair in each top speed and acceleration subcategory and a relative comparison is made using the unmodified diesel bus pair as the standard. The best complete set of results between each bus technology pair determines the final result for each technology type. Grades ranging from 0% to 21% are used to determine performance on flat ground, medium hills, and steep hills. Muni's maximum grade of 21% is found on the Hyde Street cable car line.[37] The second most extreme Muni line grade is found on the 1-California trolley coach line as it leaves Chinatown.[38] 4.2. Definitions: 4.2.1. Set is defined here as all of the top speed and acceleration results for a single vehicle. 4.2.2. Subset is defined here as a singe category within the main categories of top speed and acceleration. For example, a performance subset is 0-40 mph acceleration on a 0% grade. 4.2.3. Full passenger load is defined here as not being able to accept additional passengers onto the bus. This assumes that all passengers are behind the yellow passenger line in front, and are not standing directly in the rear door area. 4.3. Test Procedure: 4.3.1. Top Speed: Top speed runs on 0% and 2% grades begin with rolling starts. Both grade locations cover sufficient distance to allow the vehicle to reach terminal speeds. Top speed runs for all but 0% and 2% grades begin with the vehicle's front bumper at the base of each hill. Vehicle speed is zero (0) at the start of all but the 0% and 2% grade runs. For 0% grade, starting speed is 55 mph.[39] For the 2% grade, starting speed is 45 mph.[40] 4.3.2. Acceleration: Acceleration runs begin with both axles completely on the test grade; the measured angle of the vehicle's passenger isle is identical to the angle of the grade. 4.3.3. Driver Commands: The test driver is given simple, consistent verbal commands. Upon hearing the command to accelerate, the driver will press the throttle pedal immediately to the floor. Data recording will not start until the throttle pedal hits the floor. The throttle remains fully depressed throughout each acceleration run. Every effort is made to eliminate performance variation caused by different driving styles. 4.3.4. Determination of Speed: When the predetermined terminal test speed is attained, either the vehicle speed is taken (during top speed determination), or the stopwatch is stopped (for acceleration times). 4.3.5. Determination of Subset Results: Three (3) readings are taken for each performance data subset. The two (2) best performance readings in that subset are then averaged to determine the final result for that particular subset. For example, if the top speed readings for a particular subset are 59 mph, 60 mph, and 62 mph, then the final result for that subset will be 61 mph. Two (2) significant figures are used to express the final result of all subsets, primarily due to measurement resolution. 4.4. Site Conditions: 4.4.1. Data is collected in dry weather conditions. Extreme weather temperatures and wind are avoided during testing. 4.4.2. There is no interference from traffic or other variables that could effect the consistency of the data collected for all test vehicles. 4.5. Vehicle Conditions: 4.5.1. Starting Vehicle Weight: Each vehicle's fuel supply and other fluids are completely full at the beginning of each performance test set. 4.5.2. Test Vehicle Weight: In addition to the starting vehicle weight (4.5.1), each vehicle carries a simulated full passenger load of 85 passengers, not including the driver, during each test set. It is assumed that each passenger weighs 150 pounds, and therefore the total passenger load for testing equals 85*150=12,750 pounds. 4.5.3. Determination of Full Passenger Load: Full passenger loads were determined by auditing 40-foot bus passenger loads during peak commute hours on the 71-Haight motor coach line. It was determined that 85 passengers represented an average full passenger load. Passenger loads as high as 97 people were found on a 40-foot bus operating the 71-Haight line. However, for this analysis 90+ passenger loads do not fit the theoretical definition of a full passenger load (4.2.3). In general terms, an 85-person passenger load on a 40-foot Muni motor coach represents a bus with a passenger in every seat, a standee for each seated passenger, plus another five (5) passengers. 4.5.4. Justification for Exceeding Gross Vehicle Weight (GVW): GVW is the manufacturers' recommended maximum total vehicle weight including passengers. This weight is exceeded for all AFPP buses when they are loaded with 12,750 pounds for testing. Vehicle weights in excess of GVW are common for Muni's 40-foot buses when in revenue service, especially during commute hours and special events. Of AFPP test vehicles: the conventional diesel bus can carry 78 passenger before reaching GVW; the hybrid bus can carry 73 passengers before reaching GVW; the CNG bus can carry 58 passengers before reaching GVW.[41] Rather than evaluate the AFPP buses using an unrealistic standard for San Francisco, it was determined that actual passenger loads be used (4.5.3). In reality, if a bus has room for additional passengers, Muni patrons expect the bus operator to allow them to board. In other words, the physical space inside of a bus is what actually dictates passenger loads when a bus is in service, not the weight that the bus is carrying. Examples of passenger load conditions that potentially exceed even the 85 passengers per bus that defined AFPP test conditions: standard daily commute hours; special event and holiday operation;[42] and emergency/disaster evacuation. 4.5.5. Simulating a Passenger Load: Full passenger loads are simulated by filling the test bus with plastic water containers equal to the weight of 85 passengers (4.5.2). Both the weight of the water and the container were taken into account when calculating the total simulated passenger load. The simulated passenger load is equally spaced throughout the interior of the vehicle, including the seats, in an identical manner for each vehicle. The containers are then secured so that they remain immobile throughout the test. 4.6.
Significant Variables:
4.6.2.
Wind: For all 0% grade evaluations, each of
the three (3) data points represents an average of two (2) runs, with the
second run being made in the opposite direction of the first. This provision is made in an attempt to
limit the effect of wind force on the test results. 4.7.
Data Collection Equipment:
4.7.1.
Stopwatch: During acceleration testing, a digital
stopwatch is used to determine acceleration times. The same digital stopwatch is used for all vehicles. Stopwatch resolution is +/- 0.01
seconds. 4.7.2.
Speedometer: Analog Speedometer Readings: Data collector is to make every effort
to eliminate parallax for all test readings. The speedometer reading was verified prior to any
testing. This verification was
done by correlating the analog speedometer reading with the onboard digital
telemetry reading. The
predetermined speed mark on the speedometer is defined as the center of that
mark lined up to the center of the gauge dial indicator. Combined probability of speedometer
error = +/- 1%. 4.7.3. Protractor: Test grades were found using a calibrated digital
protractor. The device units are degrees, so a conversion factor was used
to determine grade. Protractor resolution is +/- 0.1 degrees, or +/- 0.175%
grade.
4.8. Test Personnel: Personnel consistes of one (1) driver and
one (1) data collector. The data collector operates the timing equipment,
witnesses the required vehicle speeds, and recorded test results. This
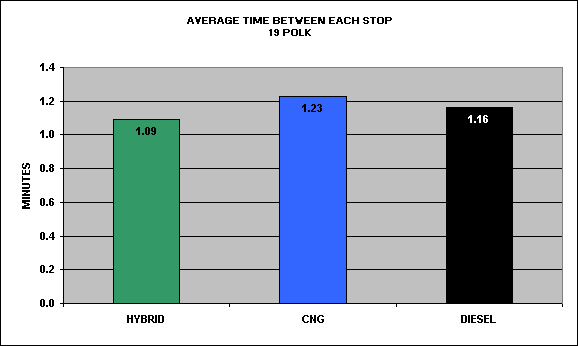
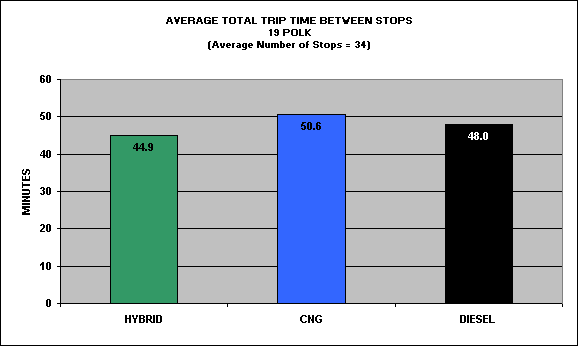
category evaluated the in-service average time between bus stops for each
technology type. Since there is a
chassis mix between low-floor buses and high-floor buses, stop dwell times
differ significantly. Therefore,
total trip time for each technology is based upon the high-floor control group's
average dwell time. Overall, the
hybrid buses had the shortest average time between bus stops, and gain roughly
6% of total trip time when compared to the control group. CNG buses
had the slowest overall line times.
This is likely due to the extreme grades found in certain sections of
the 19-Polk line, which hampers the performance of the CNG buses.[43] Other
lessons learned: Low-floor buses,
like the CNG and Hybrid buses in this test, were found to have much lower stop
dwell times than high-floor buses.
In general, low-floor buses, regardless of the propulsion technology,
can reduce trip times. Next
steps: Data from additional routes
is necessary in order to make a more accurate analysis of operational times. RESULTS TABLE 11 TABLE 12 EVALUATION
CRITERIA 5.1.
Evaluation: Data
is collected for each bus technology pair, with the exception of the unmodified
diesel bus pair, and a relative comparison is made using the PM filer equipped
diesel bus pair as the standard. For
purposes of this category, the PM filter and unmodified diesel bus pairs are
considered together as the control group. 5.1.1.
Data
Collection: The alternative
propulsion vehicles in the AFPP are low-floor buses, while the conventional
diesel buses have high floor configurations. Therefore, operational dwell times are not representative of
the different propulsion technologies being evaluated. Every effort is made to eliminate this
unwanted variable by using the following evaluation compensations: 5.1.1.1.
Isolating Dwell
Time: In addition to total trip
time, time between stop data is collected. Therefore, the summation of times between stops, subtracted
from the total trip time, equals the total dwell time. 5.1.1.2.
Corrected Total
Trip Time: The control group
(high-floor) average dwell time for a particular run is multiplied by a
particular test vehicle's number of stops, and added to the same test vehicle's
total time between stops to arrive at a "high floor total trip time"
for that test vehicle. 5.1.1.3.
Average Time
Between Stops: Average time between
stops is considered directly comparable between technologies for any identical
run, since there are roughly 200-300 stops per run to be averaged. These times have nothing to do with the
high or low floor configurations. 5.1.2.
Unique
Conditions: Any condition that
proves unique to one vehicle during data collection of operation times is
either removed from the data set or the particular run is thrown out. An example of this would be a truck
that completely blocks the road during one trip. In this case, the data collector will note the estimated
delay time to the second and subtract this from the recorded time for that
segment and total trip. 5.1.3.
Passenger
Counts: Passenger loads are
recorded for every designated stop the test bus makes. These load counts will ensure that
comparable passenger loads are used for operation time analysis. 5.2.
Site Conditions: 5.2.1.
Comparable
Days: Every effort is made to
collect data on identical runs when the vehicle test conditions are most likely
to be similar between vehicle types.
For example, Fridays or days when the there is a Farmer's Market on a
particular test run are avoided due to unusually high vehicle and pedestrian
traffic on those days. 5.2.2.
Line
Compatibility: Data cannot be
collected on any line where the buses have difficulty navigating for any
reason. All AFPP vehicles have
proven compatible with every line evaluated during the initial 6 months. 5.3.
Vehicle Conditions:
5.3.1. Inspection: A thorough inspection and evaluation is performed
of the vehicle's systems prior to testing. For example, the brakes must
function properly.
5.3.2. Operator Approval: The operator must feel like the vehicle
performs well for its technology type.
5.3.3. Propulsion System: There must not be any propulsion system
maintenance codes present. Fuel and all other fluids must be full.
5.4.1. The same digital stopwatch and digital clock is used for all
vehicles.
5.4.2.
The stopwatch
timer has resolution to one-hundredth (0.01)of a second. Times are rounded to the nearest
one-tenth (0.10) of a second. 5.5. Test Personnel: Personnel consist of one (1) driver, and
two (2) data collectors. The first data collector operates the timing equipment
and records test results. The second data collector records passenger count
data at every designated stop the vehicle makes.
5.6. Significant variables: The same operator must drive for every
technology type on a given run, in an attempt to reduce driver related variables.
Category
leader: Conventional diesel. Alternative leader: Hybrid. Fuel
economy for each technology was evaluated in terms of diesel gallons. By converting CNG energy to its diesel
equivalent, a direct comparison was possible between the different fuels
evaluated in this report. The
conventional diesel buses are over 26% more fuel efficient than the hybrid
buses. The hybrid buses are 25%
more fuel efficient than the CNG buses.
Overall, conventional diesel technology is over 58% more fuel efficient
than the CNG buses. The
relatively low fuel economy result from the hybrids is somewhat
surprising. However, while numbers
differ, the general on-road results pattern (conventional diesel leading,
followed by hybrid followed by CNG) is consistent with that found during
chassis dynamometer emissions testing.[44] It should be noted that unlike their
passenger car counterparts, which are well known for their superior fuel
economy, hybrid transit buses are configured and optimized very differently
than these passenger car hybrids.
Furthermore, data collection was interrupted during the hybrid and
unmodified conventional diesel evaluations, which potentially compromised the
long term fuel economy data for the hybrids. Therefore, the hybrid data reported here represents only
short-term fuel economy for the hybrid buses, and could change during the
remaining course of the program. Other
lessons learned: Due to Muni's early
switch from ~120 ppm sulfur CARB-2 diesel fuel to ~15 ppm sulfur ULSD[45]
fuel during the initial evaluation period, fuel economy reported here for
diesel fueled buses with PM filters may not be optimized due to excess sulfur
in the filter. Once the PM filters
have been properly serviced by the filter manufacturers, fuel economy for those
buses is expected to increase. Next
steps: Hybrid bus data should be
recollected to better reflect long term fuel economy. All PM filters should be factory serviced due to Muni's
conversion to ULSD fuel, and data should be recollected on those vehicles. TABLE 13 FUEL
ECONOMY: 6. FUEL ECONOMY 6.1.
Evaluation: Data is collected for each bus
technology pair, with the exception of the unmodified diesel bus pair, and a
relative comparison is made using the PM filter equipped diesel bus pair as the
standard. Fuel records are kept
for fuel added and odometer mileage at the time of each fueling. Total mileage (mi) during measured
segment divided by total fuel used during that segment (DGE) equals miles per
diesel gallon (mi/DGE). 6.2.
Definitions: Due to the dissimilar physical states
of fuel being evaluated (gas and liquid), energy content is used to compare
fuel economy. Fuel economy results
are represented in units of miles per diesel gallon equivalent (mi/DGE). 6.2.1.
DGE: Diesel fuel energy content is measured
in this study in units of diesel gallon equivalents (DGE). One (1) DGE is defined as 139,000 BTU's. Diesel fuel referenced here is ultra
low sulfur diesel (ULSD). ULSD is
defined as having less than or equal to 15 parts per million (ppm) sulfur
content. 6.2.2.
GGE: Compressed natural gas (CNG) is
measured in this study in units of gasoline gallon equivalents (GGE) and
Therms. One (1) GGE is defined
here as 128,000 BTU's. 1.086 GGE =
1.000 DGE. One (1) Therm = 100,000
BTU. 1.39 Therms = 1.00 DGE. 6.3.
Significant
Variables: 6.3.1.
Hybrid
Diesel-Electric Bus Correction Factor:
Every effort is made to treat the hybrid technology as "transparent"
in terms of daily operation. For
example: The hybrids are simply started before going into service, allowed to
idle while the operator makes seat/mirror adjustments and performs a pre-trip
inspection, and they are then driven into service. Likewise, at the end of a run, the buses will be fueled (if
required) and parked. Because of
this transparent treatment, no provisions are made for battery state of charge
(SOC) variations during normal operations. In keeping with the theory of transparent operation, fuel
economy numbers for the hybrid buses are "in-use" numbers, and not
necessarily actual fuel economy.
In order to determine actual fuel economy for the hybrids, one would
need to correct for battery state of charge. 6.3.2.
Loads and
Operating Conditions: Passenger
loads and operating conditions varied during fuel economy data collection. Load and operating variability can
influence fuel economy data. Category
leader: Conventional diesel. Alternative
leader: CNG. Range is
the measure of how far a vehicle can travel per full fuel load. Useful range is clearly less than this
maximum range number, since running out of fuel is unacceptable when the bus is
in-service. The conventional
diesel buses with PM filers can travel more than 20% farther than the CNG
buses. Hybrid range data
collection was interrupted, so the range number reported here is estimated
(based on 100 gallon fuel tank and 3.0 mpg fuel economy). Based on this estimate, the CNG buses
can likely travel up to 30% farther than the hybrid buses.[48] Overall, the conventional diesel buses
with PM filers can travel 22% farther than the CNG buses. Other
lessons learned: The CNG range
data is based on the fuel system pressure dropping to minimum recommended
operating levels. It should be
noted that the CNG buses could continue on after this point.[49] The hybrid range data is estimated
based upon fuel economy data.
Furthermore, true hybrid range data must be calculated once actual range
data is corrected with battery state of charge data. Next
steps: Hybrid range data should be
recollected. TABLE 14 VEHICLE
RANGE: 7. RANGE 7.1.
Evaluation: Data is collected for each bus
technology pair, with the exception of the unmodified diesel bus pair, and a
relative comparison is made using the PM filter equipped diesel bus pair as the
standard. Records are kept for
odometer mileage at the time of full fueling. The vehicle then operates at all times either in revenue
service or otherwise on surface streets in San Francisco. Freeway miles accumulated during range
evaluation are avoided or are kept to a minimum. Total mileage (mi) accumulated at the time of fuel
starvation equals vehicle range.
Note that the usable range should generally be considered 25 miles less
than the actual range. 7.2.
Definitions: 7.2.1.
Vehicle
Range: Range is defined here as
the distance (mi) traveled per full vehicle fuel load at the time the vehicle
runs out of fuel. 7.2.2.
Out of Fuel: Running out of fuel, is further defined
as the vehicle's engine running out of fuel; fuel starvation. Fuel starvation occurs when it is
confirmed the engine cannot draw any fuel from the vehicle's gas supply. This definition is needed for the
following reasons: 7.2.2.1.
For CNG, full
fueling is defined as 3600 psi on the fueling station pump gauge. 7.2.2.2.
Muni's CNG buses
are considered out of fuel in this evaluation if the vehicle's supply fuel
pressure reaches 200 psi. At this
point a driver warning alarm is sounded due to the possibility of fuel
starvation caused by low primary fuel supply pressure.44 7.2.2.3.
The diesel fuel
systems in this evaluation may not be able to draw the entire fuel supply;
after the point of fuel starvation there may still be residual fuel in the fuel
tank. This lowers the useable
volume of the fuel tank to below specified tank capacity, and differentiates
actual range from theoretical range. 7.3.
Significant
Variables: Passenger loads and
operating conditions may vary during range evaluation. Load and operating variation can have
an influence on range data.
Operator Feedback
Passenger
Feedback Category
leader: Conventional diesel. All
operators of the test buses were asked to fill out driver surveys following
each run (a run is a set of round trips on a specified line). Seven (7) operators responded,
representing roughly 17% of AFPP trained operators.[51] The majority of operators that
responded prefer the conventional diesel buses that they are familiar
with. Of note was that none of the
operators responded as preferring the hybrid buses, however, the majority of
operators feel that the hybrid buses perform roughly the same or better than
conventional diesel buses. Hill
climbing performance and acceleration from a stop were emphasized as the
shortcomings of the CNG buses. Noise
level and braking effort were preferred on both the CNG and hybrid buses, and
the overall smoothness of the hybrid buses when accelerating and stopping
impressed the operators.[52] Other
lessons learned: Greater run
variety is needed in order to obtain more feedback. Of the standard motor coach fleet, operators prefer the 1999
NABI diesels. Next
steps: The buses should be
evaluated by a larger number of operators, from a larger number of different
lines. TABLE 15 The
following questions and answers are taken from the CNG section of the written
surveys. All responses are listed: Q - Any
problems related to CNG engine? A - No CNG
specific problems were reported by operators. Q - Should
Muni buy CNG buses? A - "No." A - "Not
to be recommended." A - "No." A - "Not
if hybrids available." General
CNG comments from written surveys:[53] " will
not pull hills." "Bus
are very low, slow on the take off, bouncing " "Please
note for the record that this equipment is wholly inadequate. It is too slow and underpowered for the
express line that I had to work today." "It's
a good bus for tour traps. But not
for city lines." "Unsatisfactory" "My
assessment is it is a excellent coach.
But not for San Francisco bus lines. We have lots of hills, which hampers this coach. Slow acceleration on hills and in
traffic." "New
equipment always seems better because it is new." "I don't
feel the CNG bus would be good for Muni.
It was very slow, underpowered and heavy to steer. It might be good for commuter freeway
lines but it would add 25% to our running times." "Fair." "When
I drove the bus it had 5,000 miles and felt like it had 200,000 miles. I noticed that it was losing speed and
power from when I tested it and the bus only had 1,000 miles." The
following questions and answers are taken from the hybrid section of the
written surveys. All responses are
listed: Q - Any
problems related to the hybrid propulsion system? A - The
only hybrid propulsion system problem that was reported was that the interior
noise was unacceptably high.[54] Q - Should
Muni buy hybrid buses? A - "Not
on hills." A - "No." A - "Buy
some." A - "Yes." A - "Yes." A - "If
the (interior) noise can be minimized then maybe yes." General
hybrid comments from written survey:44 "Coach
is not for SF operation." "Should
perform on some lines without grade." "The
public is very intrigued by a non-polluting electric bus that doesn't need to
be on wires." "At
this stage, it's too early to give comment." 8. OPERATOR FEEDBACK 8.1.
Evaluation: Data is collected for each bus
alternative technology pair and a relative comparison is made using the Muni's
conventional diesel bus fleet as the standard. Operator feedback is primarily collected using evaluation surveys. Operators of the test buses are asked
to complete the surveys at the completion of each service run in a test
bus. The second form of operator
feedback is in written form, such as a letter or email. 8.2.
Significant
Variables: While all operators of
test buses are asked to provide feedback, individual time spent driving the
test buses differs significantly.
This is generally due to the training schedules, the availability of the
test buses, operator schedules, and the different runs that the buses are
assigned to for different phases of the testing program. In order to gauge passenger opinions
regarding the alternative technologies in this program, a preliminary seven (7)
question survey was designed. The
survey has been tested briefly in the field. Based on a very limited sample of 18 surveys and follow up
discussions, some potential trends have already been noticed.[55] 1) Riders are generally concerned with all kinds of emissions but
don't view Muni as a major source of urban emissions. 2) Most riders feel that a different fuel source probably means a
cleaner burning bus; and they can tell that these buses look different than the
rest of the fleet. 3) Riders want dependable service first and foremost, but would
prefer to ride cleaner buses whenever possible. Other lessons learned: These in-field survey tests have
revealed that some questions may need to be refined if we are going to measure
any significant preference for alternative technology buses compared to
conventional diesel buses. Next steps: Refine the survey and continue to
administer throughout the 24-month AFPP. Results to date are inconclusive due to
limited data. During the ongoing testing the intent is to
survey Muni's ridership in an effort to measure rider opinions in a three main
areas: 1) Are Muni riders concerned with emissions from Muni buses and do
they view Muni as a significant source of urban emissions? 2) Do Muni riders understand the technical difference between
alternative technology buses and diesel buses; can they detect a difference
(look, feel, smell)? 3) Do Muni riders have a significant preference for alternative
technology buses compared to diesel buses. 9. PASSENGER FEEDBACK 9.1.
Evaluation: Data is collected for each bus
alternative technology and a relative comparison is made using the Muni's
conventional diesel bus fleet as the standard. Passenger feedback is primarily collected using evaluation
surveys. 9.2.
Test Procedure: The surveys are verbally given to
passengers while the test bus is in revenue service. The goal is to eventually administer the surveys to a large
number of passengers in order to better represent public opinion. 9.3.
Significant
Variables: 9.3.1.
Language: The survey is given in English only,
which may prevent many Muni riders from providing feedback. 9.3.2.
Runs: The survey is given on a specific runs
only; the survey is only given in certain parts of the city at certain times of
the day. 9.4.
Test
Personnel: Test personnel who are
clearly identified as Muni employees administer the surveys.
Reliability
20-Hour
Performance
Maintenance
Feedback Category
leader: Conventional diesel. The
average number of miles that a vehicle travels between failures is the measure
of reliability that is used in this analysis. The clear reliability advantage goes to conventional diesel
technology. CNG and hybrid
technologies have proven significantly unreliable in service when compared to
the control group. Results are
broken down into propulsion system and chassis categories. While
conventional diesel technology appears over four (4) times more reliable than
CNG technology, and over ten (10) times more reliable than hybrid technology,
it should be noted that these alternative technologies are new to Muni, and
these results were anticipated during the initial 6-month period. However, Muni's reliability rates for
these new technologies are very close to New York City Transit's (NYCT)
reported reliability rates for these technology types during their first six
(6) months in service.[56] Regardless, poor reliability rates
directly translate to poor service, it also correlates to low test mileage
accumulation, which compounds analysis difficulties. The PM filters required cleaning one (1) time during the
initial 6 months of testing.
Reliability rates for the PM filters will be unknown until additional
data has been collected. Other
lessons learned: Six (6) months is
not enough time to build up sufficient vehicle mileage on the alternative
technology buses to perform an accurate analysis of reliability. While this report is primarily
concerned with the evaluation of alternative fuels and propulsion technologies,
it should be noted that the additional weight added by CNG fuel tanks and
hybrid battery loads reduces the number of passengers that a bus can hold
before reaching its maximum allowable gross vehicle weight (GVW). Of AFPP test vehicles: the conventional
diesel bus can carry 78 passenger before reaching GVW; the hybrid bus can carry
73 passengers before reaching GVW; the CNG bus can carry 58 passengers before
reaching GVW.[57] Additional vehicle weight can also
increase brake wear rates, however, hybrid brake wear rates seem to be better
due to hybrid system's supplemental regenerative (electric) braking. Next
steps: It is crucial to the
analysis of reliability rates that the vehicles build up additional
mileage. Engine oil samples should
be analyzed in order to help predict long-term engine wear patterns. RESULTS TABLE 16 RELIABILITY
RATES DURING INITIAL 6-MONTHS: 10. RELIABILITY 10.1.
Evaluation: Data is collected for each bus
technology pair and a relative comparison is made using the conventional diesel
bus group as the standard. All
records for the first six (6) months in service are evaluated for each
technology pair in order to determine the total reliability of each technology.[58] PM filters were installed on test buses
following their initial six (6) months in service, so the 6-month reliability
of the PM filters alone will be evaluated separately. This study is primarily concerned with the evaluation of
different propulsion systems and configurations, so chassis reliability rates
are evaluated separately. A
relatively high mileage number result is this study's measure of relatively
superior reliability. In other
words, a more reliable vehicle can accumulate relatively more miles between
in-service failures. 10.2.
Definitions: 10.2.1.
Reliability: Mean Distance Between Failure (MDBF) is
the measure of reliability used in this study. Reliability for this study is further defined by two (2)
categories: Propulsion system
failures and chassis failures. 10.2.2.
Propulsion system
is defined to include engine, transmission, system generator, traction motor,
rear axle, fuel system, batteries, cooling system, and all accessories
associated with the normal operation of one of these systems. 10.2.3.
Chassis failures
encompass all non-propulsion system areas of the vehicle, including but not
limited to: Doors, suspension,
foundation brakes, windows, tires, and lighting. 10.2.4.
Failure: Chassis or propulsion system failure is
defined as any event or problem that produces a road call or will not allow a
vehicle to go into service. 10.3.
Test Procedure: 10.3.1.
Repair
Records: All unscheduled vehicle
repairs are recorded. Vehicle
mileage at the time of an unscheduled repair is used to determine MDBF. 10.3.2.
Road Calls: All road calls are noted in the repair
records, and are differentiated from failures that prevent a vehicle from going
into service. 10.3.3.
Out of Fuel: Propulsion system failure includes fuel
starvation if there remains sufficient fuel to supply the engine. However, this is not to be confused
with an out of fuel condition, where there is no more fuel available for the
engine. Although an out of fuel
condition requires a road call, the event is not included in this evaluation of
reliability. This is due to the
fact that each vehicle in this study has sufficient fuel capacity to operate
for more than 24 hours in revenue service without refueling. 10.4.
Significant
Variables: There are many factors
that contribute to a vehicle's reliability. Examples of the variables involved include, but are not
limited to: Driving technique;
maintenance; passenger loads; grade conditions; weather conditions; and road
conditions. In general, the level
of equal distribution of these variables between the test buses is proportional
to combined vehicle mileage, assuming all test buses accumulate roughly equal
mileage. Category leader: Inconclusive, due to non-ideal test conditions. This
category considers the reliability of the buses as they operate continuously
for 20 hours in peak ambient temperature conditions. Data was not available for this initial 6-month report,
primarily due to the relatively mild winter temperatures in San Francisco
during this time. Other
lessons learned: All test buses
proved reliable when operated continuously in relatively mild ambient
temperature conditions. Next steps: Be prepared to collect 20-hour
performance data when conditions are ideal for testing. EVALUATION
CRITERIA 11. 20-HOUR PERFORMANCE
11.1. Evaluation: Data is collected for each bus technology pair
and a relative comparison is made using the unmodified diesel bus pair as the
standard. This is a pass or fail category in the AFPP. The evaluation
consists of operating all test vehicles on a characteristic route, while run continuously
in peak ambient temperatures for 20 hours. At the end of 20 hours in operation,
the vehicle must pass the following criteria:
11.1.1. Operator Evaluation: The operator must feel like the vehicle
performs roughly the same at the beginning and end of the 20-hour performance
run.
11.1.2. Diagnostic Codes: Propulsion system maintenance codes
cannot be present when the vehicle is inspected following the 20-hour performance
run. If there is a code, it could signify a problem with the engine or propulsion
equipment.
11.1.3. Maintenance Inspection: The vehicle propulsion system
must not display any fluid leaks, air leaks, noises, signs of overheating, looseness
in mountings or attachments, or other form of wear or problem when the vehicle
is inspected following the 20-hour performance run.
11.2. Test Procedure:
11.2.1. Operation: The test will assume normal vehicle operations.
11.2.2. Terminal Breaks: The vehicle is only turned off during
the operator's terminal breaks.
11.3. Site Conditions: This test is performed during dry and peak ambient
temperatures conditions.
11.4. Vehicle Conditions: A thorough inspection and evaluation
is performed of the vehicle's propulsion system prior to testing.
11.4.1. Operator Acceptance: The operator must feel like the vehicle
performs well for its technology type before 20-hour testing begins.
11.4.2. Diagnostic Codes: Propulsion system maintenance codes
cannot be present when the vehicle is inspected prior to the 20-hour performance
run.
11.4.3. Maintenance Inspection: The vehicle propulsion system
must not display any fluid leaks, air leaks, noises, signs of overheating, looseness
in mountings or attachments, or other form of wear or problem when the vehicle
is inspected prior to the 20-hour performance run.
11.4.4.
Fluids: Fuel and all other fluids must be full
or at proper levels. 11.5.
Significant
Variables: Passenger loads and
operating conditions vary during 20-hour performance data collection. Load and operating variability can
influence reliability data. 11.6.
Data Collection
Equipment: Standard vehicle
maintenance and diagnostic equipment is used to diagnose and inspect the
vehicle. Category leader: All. SUMMARY
Three
mechanics, with 39 years combined experience with Muni function as the primary
maintenance team for the test vehicles.
They were surveyed for their opinions regarding the maintenance of the
different technologies represented in the program. The mechanics all agreed that overall build quality and
maintenance practices determine reliability rates. While acknowledging that the alternative technologies are
not yet reliable at the 6-month point in the program, all were in agreement
that the technologies would become generally more reliable as they accumulated
additional miles. Each mechanic
felt that the most important element in successful maintenance of the
alternative vehicles was to have proper training, tools, and maintenance areas
provided prior to receiving a new procurement of buses. Maintenance division supervisors, and
Local 1414 have also placed a strong emphasis on this point.[59] Other
lessons learned: Reliability
comments come from mechanics that have volunteered for the AFPP. Their optimistic comments do not
necessarily represent the opinions of other Muni mechanics that were not
interested in applying for the AFPP positions RESULTS TABLE 17 MAINTENANCE
SURVEY - RELATIVE RELIABILITY RATES: The
following comments are taken from written surveys: Reliability: Daily reliability:
Each of
the three (3) AFPP mechanics stated that reliability is directly related to the
build quality of the entire vehicle.
One comment was that if all motor coaches are maintained identically by
Muni, they should therefore be equally reliable in daily service. Another comment was that the CNG engine
and fuel system may not be as reliable on a daily basis as conventional
technology. Long-term reliability:
The AFPP
mechanics were split regarding which technology would be most reliable in the
long-term. One stated that
conventional diesel technology will have the same reliability as past motor
coach fleets. Two stated that
hybrid technology will have the same reliability as past motor coach
fleets. In response to the hybrid
bus reliability problems during the initial 6-months, it was thought that
hybrid buses will become more reliable as this new technology is developed. Relative reliability:
AFPP
mechanics stated that the CNG buses are generally more reliable than the hybrid
buses, but neither CNG or hybrid technology has proven reliable to date. Furthermore: "We do not
have the proper tools, place and safety precautions in place to work on CNG
coaches, until that has been done, I believe hybrids are more realistic. I would also believe fuel cells to be
the future of transit." Safety
comments: CNG:
If
appropriate training is provided, Muni mechanics will have every reason to feel
comfortable and safe working on CNG buses. Two (2) AFPP mechanics stated that, in reality, CNG buses
may not receive the same level of maintenance attention as conventional diesel
buses due to safety concerns - even if appropriate training is provided. Hybrid:
Each of
the three (3) AFPP mechanics stated that if appropriate training is provided,
Muni mechanics will have every reason to feel comfortable and safe working on
hybrid buses. Technology
specific comments: CNG:
Two (2)
AFPP mechanics stated that whether the buses are different or not makes no
difference as long as appropriate training, tools, and infrastructure are
provided. Hybrid:
Two (2) AFPP
mechanics stated that Muni should use hybrids to transition its motor coach
fleet to be on par with Muni's trolley bus and light rail vehicle (LRV) fleets
by using the most modern forms of electric bus propulsion technology currently
available. EVALUATION CRITERIA
12. MAINTENANCE FEEDBACK 12.1.
Evaluation: Data is collected for each bus
technology pair and a relative comparison is made using Muni's conventional
diesel fleet as the standard.
Maintenance feedback is primarily collected using evaluation
surveys. Maintainers of the test
buses are asked to complete the surveys at six (6) month intervals throughout
the program. The second form of
maintenance feedback is in written form, such as a letter or email. 12.2.
Significant
Variables: From two (2) to three
(3) maintainers are assigned to the test buses at any one time. Therefore, feedback from maintenance
supervisors familiar with the test buses is encouraged in order to increase the
number of responses.
Operating cost
Capital cost Category
leader: Conventional diesel. Alternative
leader: Hybrid. SUMMARY
Operational
cost was split into three (3) subcategories: Fuel cost per mile, maintenance cost per mile (which
includes repair and routine maintenance costs), and total vehicle cost per
mile. Based on fuel alone, the
conventional diesels appear to be over 22% less expensive to operate when
compared to the estimated fuel cost per mile for the hybrid buses, and 40% less
expensive to operate when compared to the CNG bus fuel cost per mile. Fuel prices are based on the cost that
Muni pays for diesel fuel[60]
and what Sacramento RT pays for CNG. Maintenance
cost results here are not representative of life-cycle costs due to the fact
that the alternative buses are a new experience for Muni, and the conventional
diesel buses represented here are not entirely different than all of Muni's
past diesel buses. In addition, 6
months is not sufficient time to accurately predict life-cycle maintenance
costs, and these results are inconclusive. In general, the conventional diesel buses were the least expensive
per mile to maintain, followed by the hybrid buses, and finally the CNG buses. While no
long-term projections have been calculated due to the limited data available
after 6 months of testing, it should be noted that the cost to replace hybrid
propulsion system batteries, roughly every two (2) years, is about $10,000 per
bus, or $60,000 over the 12-year life expectancy of each hybrid bus.[61] Other
lessons learned: Fuel prices are
constantly changing, and it is therefore difficult to predict long term fuel
pricing. Maintenance data is
greatly influenced by the fact that these alternative technologies are new to
Muni, and require additional time to establish the repair patterns found with
the conventional diesel buses. Next
steps: Fuel economy data should be
recollected for all test vehicles, and fuel cost per mile should be
recalculated based on these revised fuel efficiency numbers. Additional miles are needed on the
alternative buses in order to make a meaningful analysis of maintenance costs
and life cycle cost estimates. RESULTS
TABLE 18 FUEL COST
PER MILE: TABEL 19 MAINTENANCE
COST PER MILE: TABLE 20 TOTAL COST
PER MILE: Other
operating costs, not included in the primary cost analysis or tables, concerns
the effect of vehicle performance differences while in-service, and the cost of
special operation and maintenance training. Limited
data concerning the San Francisco operational performance differences between
the various bus technologies forced cost calculations based on the annual
operational costs for a narrow range of bus performance factors (10% slower, 5%
slower, and 6% faster). The basic
analysis sought to quantify how these seemingly minor increases or decreases in
bus performance could affect operating costs over the course of a year. This analysis defined two sets of line
assignments: for a fleet of 80 buses on the road at one time; and for a fleet
of 60 on the road at one time.
These line selections were based on directives within the 11 Point
Agreement.[65] One set of routes was determined by
environmental justice demographic considerations, and one set was defined by
topographic considerations, whereby relatively flat or mild grade routes were
selected to better accommodate alternative fuel buses. Both line assignments demonstrated that
a single percentage point in bus performance can cost over $200,000 annually. One might reasonably expect that a
five percent (5%) loss or gain in coach operating performance would not be a significant
factor when comparing bus technologies, and that slower buses and the resulting
service impacts could be absorbed into the existing schedules. However, Muni's service is presently
very tight and there are very few "slack" periods where slower running
times could be absorbed into the current system without reducing service
capacity, daily frequencies, peak-hour-headways and hours of service. Individually a six percent increase in
performance or a five percent decrease in performance and running times does
not seem significant. However the
detailed analysis estimates the potential, cumulative cost of an 11% difference
between the bus technologies. The
analysis indicates that (assuming service capacity and operation costs remain
constant) the cumulative annual cost of adopting a bus that is 5% slower and
concurrently rejecting a bus that is 6% faster translates into between two (2) and three (3) million dollars
annually. In order to arrive at a baseline
cost figure, the annual revenue hours for each motor coach line were determined
and multiplied by $91.26 (the motor coach variable cost per hour stated in
National Transportation Database).
This figure is the Federal Transit Administration's (FTA's) official
measure of bus costs. It includes
most operational and maintenance costs, but excludes administration and
overhead (A&O) costs, and it does not differentiate between a standard (40')
and articulated (60') coaches. In order to account for a slower buses, with
decreased performance measures, the baseline annual revenue hours figure for
each motor coach line must be factored upwards by the performance difference.
Conversely, in order to account for faster buses with increased performance
measures, each motor coach's annual revenue hours figures must be factored
downward by the performance difference.
The revised costs were then determined by multiplying the revised hours
of service figures with the $91.26 hourly cost. It is
assumed that once better data is collected concerning the performance differences
observed while in Muni service, these factors can then be plugged back into
this analysis, or the information could be given to Muni scheduling, so that
real schedules based on observed run times could be generated. EVALUATION CRITERIA
13. OPERATING COST 13.1.
Evaluation: Data is collected for each bus
technology pair and a relative comparison is made using the unmodified diesel
bus pair as the standard.
Operating cost is evaluated in terms of the cost per mile for each
technology pair. The total cost for
each technology pair is divided by the total number of miles for each
pair. Operating cost for test
vehicles include, but are not limited to, costs associated with: fuel used; maintenance labor;
maintenance parts; all non-fuel system fluids; body repair labor; and body
repair parts. All records for the
first six (6) months in service are evaluated for each technology pair in order
to determine the total cost for each technology. All warranty work is included, even if this cost is not
directly paid by Muni. This study
is primarily concerned with the evaluation of different propulsion systems and
configurations, so chassis related costs are evaluated separately. 13.2.
Significant
Variables: There are many factors
that contribute to operating costs.
Examples of the variables involved include: Driving technique; maintenance; operating conditions; fuel
pricing; market changes; and vehicle age. Category
leader: Conventional diesel. Alternative leader: Hybrid.
SUMMARY
This
category considers the incremental cost involved with purchasing alternative
technologies as well as the necessary infrastructure costs related to
supporting these alternative technologies. In general, the hybrid buses are 17-52% more expensive to
purchase than conventional diesels, but they incur significantly less
incremental facility costs at $1.05 million. The CNG buses are only 14-18% more expensive to procure, but
the incremental facility costs are estimated to be approx. $7 million for one
facility and $12 million for two facilities.[66] Other
lessons learned: The majority of
CNG fueling infrastructure cannot be converted in order to support future
hydrogen fueling needs, such as those now thought to be required for hydrogen
fuel cell powered electric buses.[67] Diesel PM filter ash/waste will have to
be managed for Muni's entire diesel fleet.[68] Next
steps: Further research should be
done in order to refine these cost estimates. RESULTS
The
incremental cost of purchasing alternative technology vehicles is due to several
factors, including low production volumes, and additional propulsion related
equipment and subsystem costs. TABLE 21 NEW BUS COST
SUMMARY59 The
incremental facility cost is due to the fact that Muni diesel facilities
require modifications in order to safely accommodate CNG vehicles.[70] These modifications were required prior
to large-scale implementation of alternative fuel buses at Muni. Many capital costs, such as those
related to facility redundancy, are relativ to the number of vehicles procured. Because of
such high risks that are typically associated with handling natural gas
equipment, the natural gas industry has been maintaining one of the highest
quality and safety assurance standards/precautions for equipment and
infrastructure. Implementing these
safety precautions in natural gas infrastructure have reduced the probability
of accidents and the impact of such accidents at various transit agencies over
the last couple decades. What follows
is a detailed comparison and evaluation of CNG and hybrid maintenance facility
requirements and costs. TABLE 22 INFRASTRUCTURE REQUIREMENTS COMPARISON: Toxic Waste Disposal TABLE 23 INCREMENTAL FACILITY COST COMPARISON -
BASED ON THE COST ASSOCIATED WITH BUILDING AND CONVERTING CONVENTIONAL DIESEL
FACITLITIES: Incremental Capital Cost for Islais Creek Facility Incremental Capital Cost for Both Islais Creek and Woods Facilities TABLE 24 THIRD-PARTY TURNKEY FUELING INFRASTRUCTURE
RESPONSES TO Muni'S INQUIRY[75] (independent of the larger facility project) + 6-9 month Muni review, safety certification and approval cycle = 12-18 months
total minimum 30-80 bus fleet for ENRG to participate appears not to include electric power, at $0.05-$0.13/DGE; $0.56/DGE gas[76] Commodity cost: $0.61-$0.69/DGE[77] 5 minute fill time per bus, 3 lanes ($375,804-$725,985 annual cost); price does NOT include gas69 or electric power 12-21 months total number of fuel lanes not indicated. EVALUATION CRITERIA
14. CAPITAL COST 14.1.
Evaluation: Capital cost is primarily concerned
with two (2) categories:
Incremental vehicle cost; and incremental support facility cost. Vehicle vendors shall be surveyed
regarding alternative technology incremental purchase costs. Muni Construction Division and Project
Integration is to form an Alternative Fuels Facility Task Force (AFFTaC) in
order to identify the capital costs necessary in order for Muni facilities to
be in compliance with the operational, maintenance, safety, and regulatory
requirements associated with alternative technology vehicles. 14.2.
Definitions: 14.2.1.
Incremental
vehicle cost is defined here as the differential cost of alternative technology
compared to the purchase cost of conventional diesel transit bus
technology. This can be a positive
or negative cost. 14.2.2.
Incremental
facility cost is defined here as the additional cost required to modify Muni's
existing motor coach facilities in order to support each alternative vehicle
technology. This cost is then
divided by the potential number of vehicles to be purchased in each alternative
technology category during life of the facility. 14.3.
Significant
Variables: There are many
variables associated with this cost analysis including, but not limited
to: Analysis of required level of
facility support; analysis of required level of safety requirements; product
availability and general market changes; level of manufacturer or provider
support desired; differential cost represented by other transit agencies
surveyed. 14.4.
Test
Personnel: 14.4.1.
Vehicle
Cost: Muni fleet engineering
personnel shall audit industry sources in order to determine incremental
vehicle costs. Sources are to
include: Vehicle manufacturers;
propulsion system providers; alternative sub-system providers; alternative
technology transit agencies. 14.4.2.
Facility
Cost: Muni personnel representing
the following areas shall contribute to AFFTaC report on the facility
implications of alternative technology vehicles: Accessibility services; capital planning and grants; capital
planning and legislative affairs; construction electrical/facilities/mechanical
design; construction project management; environmental and occupational health;
facilities subcommittee; finance; fleet engineering; system safety. Category
leader: PM filter and hybrid. SUMMARY In order
to accommodate fueling and maintaining alternative fuel buses, Muni must
construct special facilities and/or modify their existing diesel infrastructure
due to non-compliance with relevant codes and industry standards. Maintenance facility provisions for CNG
are related to safety concerns, while hybrid facility provisions are primarily
related to the storage and disposal of batteries. This analysis focuses on CNG concerns. Most of
the codes and standards were developed around the fact that storing and
handling compressed natural gas will accidentally, through human error or
equipment malfunction, leak gas into the surrounding atmosphere. Because natural gas is lighter than
air,[78]
leaking gas will quickly raise. In
an enclosed storage or maintenance facility, leaking gas will tend to
accumulate near the ceiling.
Depending on the volume of the leaking gas, the concentration of accumulated
gas near the ceiling could quickly reach the gas' lower or upper flammable
limits[79]
thus igniting or even causing an explosion in the presence of an ignition
source such as a heater or spark.
High temperature elements such as open flame heaters in diesel bus
garages will most likely cause the initial ignition of the accumulated natural
gas. Depending on the surrounding
area, storing of natural gas buses in an outside open space will definitely
reduce, but may not completely eliminate, the risk of igniting accumulated gas
in that area. RESULTS Because of
the volatility of natural gas, fueling and maintaining natural gas buses
require safety precautions that do not typically exist in diesel
facilities. In addition, diesel
facilities typically include items that are considered safety hazards for
natural gas buses. For example,
the ceiling-mounted open flame radiant tube heaters found inside the Woods
division maintenance area, although very efficient and practical in diesel
facilities, could be a risk hazard if a natural gas bus is stored or maintained
in that facility. Natural gas bus
facilities use similar heaters that are specially configured for natural gas
buses. Other examples of
non-compliant or non-exiting systems in Woods include: ventilation, fire
detection, and lighting systems. A general
list of items that should be considered prior to introducing alternative fuel
vehicles into diesel infrastructure includes, but is not limited to, the
following items:[80] a)
Gas Detection and
Alarm System b)
Heating,
Ventilation, and Air-Conditioning and System (HVAC) c)
Lighting System d)
Electrical and
Mechanical Systems e)
Fire Fighting
(extinguishing) System f)
Non-Sparking or
Explosion Proof Equipment (fans, motors, light fixtures, etc.) g)
Structural/Architect h)
Training (operation
and maintenance) i)
Fueling
Infrastructure j)
Personnel
Protective Equipment k)
Fire Department
Personnel Training l)
Emergency
Response and Evacuation Procedures m)
Community
Relations A more
detailed list based on fire, safety, and building standards/codes have been
adopted by many local officials as the governing codes for
construction/modification of alternative fuel facilities. This set of codes includes: a)
National Fire
Protection Association (NFPA) 30A: Automotive and Marine Service Station Code b)
NFPA 52:
Compressed Natural Gas (CNG) Vehicular Fuel System Code c)
NFPA 59A:
Standard for the Production, Storage, and Handling of Liquefied Natural Gas
(LNG) d)
NFPA 68: Guide
for Venting of Deflagrations e)
NFPA 88B:
Standard for Repair Garages In
addition, each community normally develops specific rules and regulations that
must also be considered during the planning, design, and construction of
natural gas facilities.[81] EVALUATION CRITERIA 15. FACILITY EVALUATION 15.1.
Evaluation: All motor coach facilities shall be
audited for compliance with the different alternative technologies represented
in this study. This aspect of the
study is concerned with the compliance of existing facilities, rather than the
potential incremental capital costs associated with modifying existing and
planned facilities.[82] The present state of each motor coach
facility and its equipment is rated as compliant or non-compliant for each
vehicle technology. Examples of
general facility evaluation categories include, but are not limited to: compatibility with lighter-than-air
flammable gases; provisions for propulsion system battery storage; and
provisions for proper hazardous material disposal. 15.2.
Test
Personnel: Both Muni personnel and
an outside consulting agency shall individually inspect existing Muni motor
coach facilities. 15.2.1.
Muni
Personnel: Inspections of each
Muni motor coach facility for compliance with alternative technologies shall be
performed by personnel: Certified
in natural gas facility evaluation; familiar with alternative technology
transit facilities; certified in electric vehicle technology and high-voltage
power systems; and trained regarding service techniques specific to exhaust
after-treatment technology. 15.2.2.
Consultant: Personnel shall evaluate Muni motor
coach facilities for alternative technology compliance based on at least the
following fire, safety, and building codes: National Fire Protection Association (NFPA) 30A - Automotive
and Marine Service Station Code; NFPA 52 - CNG Vehicle Fuel System Code; NFPA
59A - Standard for the Production, Storage, and Handling of Liquefied Natural
Gas (LNG); NFPA 88B - Standard for Repair Garages. Category
winner: Inconclusive, due to need
for additional analysis. SUMMARY The safety
category was primarily concerned with the hazards of AFPP vehicle operation on
bridges, through tunnels, under electric trolley contact wires, and inside
terminals. Secondary concerns
include threats from intentional harm, and earthquake conditions. In general, the hazard potential from
CNG buses during operation is low.
However, it is strongly recommended that certain areas be evaluated
further. Muni buses
operate around City Hall, the Federal Building, the United Nations plaza, the
TransAmerica Building, and on the Golden Gate Bridge, which may be considered
terrorist targets for various reasons.
Given the volatility of CNG relative to diesel fuel, CNG buses could be
considered a target for terrorism, but Muni considers the likelihood of an
incident to be extremely low.[83] The US Geological Survey states that
there is a 67% probability that San Francisco will one day experience another
Richter-magnitude 7 earthquake.[84] During the 1989 Loma Prieta earthquake,
electricity and natural gas supplies were unreliable in San Francisco. Fifty-three percent of Muni's entire
fleet is currently electric powered.
In the event of an emergency, with gas and electric supplies cut or
reduced, a reliable fuel source will be crucial. Forty
percent (40% or 21/52) of Muni's individual standard motor coach lines present
a specific CNG bus safety concern. The following 21 Muni lines should be
carefully considered before CNG bus service due to vehicle/infrastructure
related safety concerns that should be thoroughly investigated: 1 California; three (3) 9 San Bruno
Express lines; 10 Townsend; two (2) 28 19th Avenue lines; 29 Sunset;
two (2) 30 Stockton lines; five (5) 38 Geary lines; 41 Union; 45
Union-Stockton; 80 Gateway Express; 82 Levi Plaza Express; 91 Owl; 108 Treasure
Island. Until
further safety analysis can be performed, CNG bus operation through San
Francisco tunnels is not recommended.
While most of the tunnels have natural ventilation due to grade or
traffic flow, and any accumulation of small release of natural gas would not
likely reach the potentially flammable ranges, an complete engineering/safety
study should be performed prior to proclaiming CNG compatibility with San
Francisco's tunnels. Other
lessons learned: The San Francisco
Fire Department (SFFD) will require accident response training specific to the
CNG buses. Next
steps: One area that warrants
further evaluation is the Transbay Terminal.[85] Other areas include streets with low
trolley contact wires, where the possibility of an explosion exists in which an
errant wire may strike a CNG tank on the top of a passing bus. Hazards in long tunnels such as
Broadway, Stockton, and Macarthur present other areas for further evaluation. A comprehensive safety evaluation and
certification must be in place before the procurement of CNG buses or
modification of facilities.
Completion of a preliminary Operational Hazard Analysis should be made
as soon as possible. RESULTS Muni
safety representatives conducted a preliminary safety review of CNG facilities
requirements. The recommendation
was that all safety issues be addressed prior to the acquisition of the
CNG fleet and final design of the CNG facility. Representatives also advised that further comprehensive
operational hazard analysis will likely identify additional safety issues. These issues may involve policy
considerations, resources, and funds needed to mitigate identified
hazards. Specifically, the safety
requirements that were identified include:
Completion of a
preliminary Operational Hazard Analysis as soon as possible: The analysis must include, as a
minimum. fleet, facility, and system integration elements including city
infrastructure and operational requirements. The analysis should also include, as a minimum: CNG gas
ventilation in tunnels, citywide network of overhead trolley contact wires, and
CNG gas ventilation in facility.
Development of a
Safety Certification program for the fleet, facility and integration of the CNG
equipment and systems. Timing of
the safety certification is critical.
If the CNG facility is not certified at the time the CNG bus
certification is approved, then additional safety requirements must be
developed and certified in order to support the safe operation of the CNG bus
fleet
Establishment of
the necessary minimum employee qualifications and necessary security
requirements.
Establishment of
the necessary security requirements and development of a Security Certification
program.
Re-evaluation of
the safety risk of electric wire/CNG.
Based on Muni's current usage and volume of its overhead line system and
support structure, the safety representatives strongly recommended the
re-evaluation of the Federal Department of Transportation's classification of
an electric wire/CNG risk as "4C".[86] Muni has a formal risk assessment
program in place for Third Street Light Rail project and Metro East facility
that should be the basis for a formal risk assessment of this issue.
Coordination of
Emergency Response. An assessment of city emergency response resources should
be incorporated into the overall hazard analysis along with the safety
certification program. This list was not
intended to be exhaustive. Further
issues may present themselves in the remaining 18 months of the AFPP. Safety representatives will add new
requirements to this list as the need arises. Details
regarding CNG compliance with bridges, tunnels, low electric trolley contact
wires, the Transbay Terminal, and earthquake conditions are listed below. Lines that are associated with these areas
of San Francisco are listed in parenthesis following each specific area. Bridges: (76 Marin
Headlands) Only
vehicles that are required to display hazardous warning signs are not permitted
to use the bridge.[87] Since a CNG transit bus is not required
to display a hazardous warning sign, it is permitted to cross. (108
Treasure Island) A vehicle
with an onboard fuel supply equivalent to 120 gasoline gallons ,as is generally
the case with CNG transit buses, is permitted to use the bridge.[88] It should be noted that the Yerba Buena
Tunnel, which connects the western span of the Bay Bridge to the eastern span,
is not CNG compliant. The lower
(eastbound) deck is a also a concern due to the numerous overhead pockets. Mission
Creek Bridge[89] (15 3rd
Street; 91 Owl) This is an
open top and sides bridge that presents no hazard potential related to CNG bus
operation. Islais
Creek Bridge[90] (15 3rd
Street; 91 Owl) This is an
open top and sides bridge that presents no hazard potential related to CNG bus
operation. Tunnels: (30X
Marina Express) The
Broadway Tunnel is made up of a relatively long pair of tunnels that has a
ventilation fan in each bore.
However, these fans only operate one at a time, between 7:30 am and 3:30
pm on weekdays, and 6:00 am to 2:00 pm on weekends. The fan in the north bore is rated at 100,000 cfm, while the
fan in the south bore is rated to 30,000 cfm.[91] (9X. 9AX,
9BX San Bruno Express lines; 30 Stockton; 45 Union-Stockton, 91 Owl) The
Stockton tunnel is a relatively long tunnel that has mechanical no provision
for natural gas accident avoidance.
However, there is significant natural ventilation in this tunnel. (38 Geary
Ft. Miley; 38 Geary Pt. Lobos; 38L Geary Limited; 38 Geary Ocean Beach Owl; 38
Geary East of 33rd Avenue Owl) The Geary
tunnel has no mechanical provision for natural gas accident avoidance. However, there is significant natural
ventilation in this tunnel. (28 19th
Avenue; 28L 19th Avenue Limited, 91 Owl) The
Macarthur tunnel is a relatively long tunnel that has no provision for natural
gas accident avoidance. (28 19th
Avenue; 29 Sunset) The Golden
Gate Bridge Toll Plaza tunnel has no provision for natural gas accident
avoidance. The tunnel is roughly
50 yards long, and could be considered essentially an extended overpass. Of the six (6) San Francisco tunnels,
the toll plaza tunnel is the least likely to provide an opportunity for a
natural gas related accident.[92] Yerba
Buena Island Tunnel: (108
Treasure Island line) The
Yerba Buena Island Tunnel has no
provision for natural gas accident avoidance. However, as stated in the Bay Bridge section (above) of
these results, passage across the Bay Bridge is allowed based on the relatively
small amount of fuel CNG buses carry.
It is therefore implied that operation through the tunnel is also
acceptable. In
general, as long as a properly functioning CNG bus is driving through any of
these tunnels, there is little cause for safety concern. However, one must consider special
conditions. One must consider
special conditions that may cause safety concern when a natural gas buses are
operated in one of San Francisco's tunnels: What if there is a large CNG release in a tunnel? What if there is a series of small
releases, in a tunnel, from numerous buses over a short time frame? What if external sources of CH4 find
there way into the tunnel such as those routinely in San Francisco when a sewer
main ruptures. It is clear that
the tunnels then need modifications: Methane detectors (integrated detectors
with tunnel ventilation equipment); and non-sparking mechanical equipment and
electric services.[93] Low
Trolley Wires: Davis
Street between Clay Street and Sacramento Street: (1
California; 80X Gateway Express; 82X Levi Plaza Express; 41 Union) The
trolley wires are under a pedestrian walkway. 1st
Street and Fremont Streets between Mission Street and Howard Street: (10
Townsend; 76 Marin Headlands) The
trolley wires are under the Transbay terminal. The
concern with low trolley contact wires is that they could act as a source of
ignition if there were a natural gas leak on roof mounted natural gas fuel
cylinders. Natural gas released
under pressure may be trapped in the cupola housing the natural gas cylinders
on the roof of a CNG bus. The
escaped gas can possibly accumulate in the cupola, increasing the hazard if an
ignition source is available.[94] San Francisco's many trolley wires
operate using roughly 600 volts.
On Davis Street and below the Transbay Terminal, the wires come within 2
feet of the cupola on the top of Muni's CNG buses. Furthermore, low barometric conditions magnify the
possibility of current jumping from the contact wire to a bus. It should be noted that Muni's
low-floor CNG buses are considerably taller than any of the other motor coaches
in Muni's fleet, due to their roof mounted fuel cylinders. The trolley wires on Davis Street and
under the Transbay Terminal are roughly 13.5 feet above the street. In terms of both vehicle and system, a
trolley wire related CNG bus hazardous event may occur at some time in the life
of an individual bus, and may occur several times in the life of the electric
trolley wire system. However, the
hazard severity would be negligible, with less than minor injury, less than
minor system damage, and less than minor environmental damage.[95] Transbay
Terminal: (108
Treasure Island) Most, if
not all, diesel facilities require some modifications to accommodate compressed
natural gas vehicles. Because of
this, further analysis of the Transbay Terminal and its compatibility with
natural gas buses is warranted.
Operators report poor ventilation inside the Transbay terminal, and
often take their breaks outside of the terminal for this reason. Earthquake
concerns: The 1989
Loma Prieta Earthquake struck at 5:04 p.m. on October 17. The epicenter of the earthquake was the
Santa Cruz Mountains, about 56 miles south-southeast of San Francisco. While the main regions of destruction
were in the Santa Cruz Mountains, along the coasts of Santa Cruz and Monterey
counties, and in San Benito County, certain areas of San Francisco and Alameda
County were also hit. When the
earthquake hit, most of San Francisco lost electricity. There were hundreds of natural gas
leaks. During the evening of the
earthquake, and the following day, 36 structure fires were reported to the San Francisco
Fire Department. Of these fires, 34 were directly or indirectly related to the
earthquake and aftershocks. It has
been speculated that the failure of electric service may have been beneficial
in reducing the number of potential fires, due to the loss of a possible
ignition source for the natural gas.
However, natural gas was responsible for some of the fires following the
Loma Prieta earthquake. Reportedly
500 dispatches were transmitted by midnight of October 17, and of these,
roughly 400 were investigations of natural gas odors.[96] The USGS states that "Events of
magnitude 7 or larger, each with a probability of 20 to 30 percent are expected
at three locations in Northern California." The locations in Northern
California are the San Francisco segment of the San Andreas fault, and the
northern and southern segments of the Hayward fault in the East Bay. "A magnitude of 7 shock on any one
of these fault segments will probably cause considerably more damage than the
recent Loma Prieta event because of their proximity to larger population
centers."[97] On July 20, 1990, the USGS further
revised their probability factor for a Richter-magnitude 7 earthquake to 67%. This latest revision makes another major earthquake inevitable
as far as SFFD planning is concerned.82 16. SAFETY EVALUATION 16.1.
Evaluation: This evaluation category focuses on
safety from a vehicle perspective.
Data is collected for each bus technology and a relative comparison is
made using the Muni's conventional diesel bus fleet as the standard. The vehicles are evaluated in terms of
the hazard potential associated with categories including, but not limited
to: Tunnels; overhead electric
trolley wires; bridges; transportation terminals; intentional harm; and natural
disasters. Levels of vehicle
safety are difficult to quantify.
Due to the potentially severe consequences associated with hazardous
conditions, every effort is made to evaluate vehicle safety using a wide range
of techniques: Safety codes;
knowledge and experience from similar alternative technology users; statements
from local agencies and departments; analysis of previous accidents. 16.2.
Significant
Variables: Due to the fact that a
safety evaluation is generally concerned with either the intermittent
occurrence of known hazards, and the possibility of unknown hazards, there are
virtually endless variables that have an effect on the analysis of potential
vehicle hazards. Compounding the
variability of this safety analysis is the fact that simultaneous occurrences
of multiple non-hazardous conditions may together create a new hazard. One school of thought that states that
there is no such thing as an "accident." While this is debatable, the fact remains that controlling
all of the variables involved in an accident is the key to safety. Every attempt is made in this study to
identify known safety variables, so as to better advise regarding accident
prevention. 16.3.
Test
Personnel: Many different sources
are used in the evaluation of alternative transit vehicle safety in San
Francisco: 16.3.1.
Muni: Safety personnel are asked to evaluate
alternative vehicle safety independently of other evaluation efforts for these
vehicles. 16.3.2.
Bridges: Bridge managers and maintenance
supervisors are surveyed for alternative vehicle compliance statements based on
their particular bridge. 16.3.3.
Tunnels: Bureau of Street and Sewer Repair
personnel, and Presidio alternative fuel personnel are surveyed for alternative
vehicle compliance statements based on their particular tunnels. 16.3.4.
Overhead Electric
Trolley Wires: Federal
Transportation Agency's (FTA's) Transportation Safety Institute (TSI) is asked
to provide assistance in evaluating the hazard potential of low trolley wires
as they relate to roof mounted CNG fuel containers. TSI has previously analyzed this potential hazard in
Cleveland and Boston. 16.3.5.
Intentional
Harm: Agencies to be surveyed for
alternative vehicle compliance with potential acts of extreme vandalism and
terrorism include: San Francisco
Fire Department (SFFD); San Francisco Police Department (SFPD); California
Highway Patrol (CHP); and New York City Transit Authority (NYCTA). "11-POINT
AGREEMENT" Muni Bus Purchase Proposal Developed in
cooperation with Municipal Transportation Agency and Department of
Environment staff Background Muni
operates a fleet of 455 diesel motor coaches. Many vehicles are operating
beyond their approved 12 year life span, resulting in breakdowns and delays in
service to passengers. There is consensus that Muni's older vehicles are highly
polluting models that should be removed from service as quickly as possible. In
1997, Muni received approval from the San Francisco County Transportation
Authority to replace approximately half of its fleet (235 vehicles, including
135 40' motor coaches and 100 60' articulated coaches) with diesel buses. The
proposed contract with Neoplan also included a future potential option to
purchase 175 vehicles. Environmental
groups including the Union of Concerned Scientists, the Natural Resources
Defense Council and the SF League of Conservation Voters initially opposed the
purchase of diesel buses. At the time, Supervisor Ammiano sponsored
negotiations with Muni and the environmental coalition which culminated in an
agreement by Muni to acquire and test 2 CNG and 2 hybrid-electric motor coaches
for an alternative fuel pilot program and for Muni to develop a plan for
potential electrification of diesel routes. The Transportation Authority
approved the proposed bus purchase but provided direction to implement the
alternative fuel pilot program. Due to several factors, Muni's pilot program
had not commenced road tests as of the beginning of 2001. On
the heals of a contentious decision to adopt the diesel fuel path in response
to the CARB Transit Bus Emissions Regulations in late 2000, Muni prepared to
approach the Transportation Authority in January of 2001 for approval to
exercise its Neoplan option to replace 175 vehicles. The environmental
coalition that opposed Muni's diesel fuel path choice, which included the Union
of Concerned Scientists, the American Lung Association, Our Children's Earth, the
Planning and Conservation League and Bayview Hunters Point Community Advocates,
geared up to oppose approval of new diesel buses. Negotiations Supervisor
Ammiano requested that Muni negotiate a one month deferral of the option with
Neoplan so that the various sides could discuss a potential compromise.
Discussions occurred over approximately a three week period and included
representatives of each of the environmental organizations, Rescue Muni
(supporting Muni's position) and city staff from Muni, the Department of the
Environment, the City Attorney's Office and the Department of Public Health. The
discussions revealed underlying differences of opinion as to whether purchasing
natural gas technology would pose a risk to the reliability of Muni service and
the extent to which purchasing diesel versus alternative fuel bus technology
would reduce air pollution in the City. The
following proposed bus purchase is the product of these negotiations and has
the support of Supervisor Ammiano, Muni and Rescue Muni. Parts of the plan are
also supported by staff of the Department of the Environment. While praising
the progress made during the negotiations, the environmental coalition does not
support the final proposal due to objections about the number of diesel buses
contemplated and the failure to commit immediately to CNG technology. Proposed Muni Bus Purchase Plan This
proposal assumes release of local match dollars sufficient to purchase a total
of 95 diesel motor coaches equipped with particulate trap emission controls.
Assuming successful completion of prototype testing of CNG and diesel-electric
hybrid buses scheduled to begin this month, Muni will purchase either CNG or
diesel-electric hybrid buses for the remainder of Muni's motor coach
replacement plan, which will require at least 105 additional vehicles. The
proposal also includes:
a schedule for installing pollution controls on the
remainder of Muni's diesel fleet that is more aggressive than that required by
state regulations;
retrofit of Muni facilities to handle
lighter-than-air fuels pending identification of funding;
development of an electric trolley coach expansion
plan for up to 6 bus lines;
commencement of testing and/or in-service use of a
variety of alternative fuel bus technologies within 24 months, including fuel
cell buses;
deployment of Muni's cleanest vehicles in the City's
most polluted neighborhoods; and
interdepartmental planning to incorporate health
needs of the Bayview Hunters Point communities in future transportation
planning. The
plan is designed to ensure that Muni will, as an organization, become
experienced at adapting to and operating the newest and least polluting bus
technologies available in the future. The plan is also designed to pose the
least risk to Muni's ability to meet the service standards required by
Proposition E. Major elements of the plan are subject to future approval by the
Municipal Transportation Agency Board, the San Francisco County Transportation
Authority and the San Francisco Board of Supervisors. I.
Approve purchase of 95
diesel buses; defer purchase of 80 buses The
older 60-foot articulated buses in Muni's fleet are on average over 18 years
old, six years past their useful life, as defined by FTA standards. Muni
will purchase 24 60' articulated buses and an additional 71 standard 40' diesel
coaches under this plan. Muni will defer the purchase of the remaining 80
diesel buses pending the outcome of prototype testing of compressed natural gas
(CNG) and diesel hybrid-electric motor coaches. II.
Commence prototype
testing
of 2 CNG
and 2 hybrid-electric buses to inform the purchase of 80 40-foot coaches Starting
March, 2001, Muni will commence prototype testing of 2 CNG and 2
diesel-electric hybrid buses, with independent oversight by the Department of the
Environment, an independent consultant and a peer review panel with
representatives from transit agencies that successfully operate CNG buses. The
prototype program will last for 8 months prior to issuance of the resulting RFP
for the purchase of 40-foot coaches (3/01-10/01); prototype testing will
continue for an additional 18 months thereafter. III.
Commence specification
and procurement
by
developing an RFP for 80 CNG or diesel-electric hybrid buses Concurrent
with the prototype testing, Muni will begin developing specifications and an
RFP for 80 CNG or diesel-electric hybrid 40-foot coaches. If
prototype testing is successful, CNG or diesel-electric hybrid buses will be
operated along the following proposed routes which Muni has determined offer
the best topography and service levels for these technologies: lines 2,
16AX/BX, 17, 23, 28, 47, 80X, 81X, 82X, 88, 89. Muni's
research has found that agencies with lower ridership and lighter duty cycles
are generally more successful with CNG technology. Agencies with high ridership and heavy urban duty cycles
have been less successful; these agencies consistently cite
higher-than-anticipated operating and maintenance costs for CNG technology. This
research supports Muni's assertion that a comprehensive testing of CNG and
diesel-electric hybrid technology in the San Francisco operating environment is
essential prior to making a commitment to invest in CNG or diesel-electric
vehicles and infrastructure. IV.
Acquire a minimum of 15
CNG 40-foot coaches for revenue service, subject to satisfactory completion of
prototype testing and acquisition of fueling infrastructure To
gain revenue service experience with lighter than air alternative fuels, Muni
will purchase a minimum of 15 CNG 40-foot coaches for in-service use, subject
to satisfactory completion of prototype testing and acquisition of fueling
infrastructure. Installation of fueling infrastructure must be free, with
guarantees of CNG fuel at or below the cost of diesel or the Transportation
Authority must identify funding for fueling infrastructure. If
prototype testing of CNG and diesel-electric hybrid coaches indicates the same
reliability and the minimum conditions described above are met, Muni will favor
the purchase of CNG buses for the remaining 65 40' coaches; otherwise Muni will
seek Transportation Authority and Board of Supervisors approval to purchase 65
40' diesel-electric hybrid buses. Muni will only approach the Transportation
Authority seeking approval of the option to purchase 80 diesel coaches in the
event that prototype testing fails. V.
Purchase CNG or
diesel-electric hybrid coaches to replace 30' Orion motor coaches, contingent
on successful prototype testing Muni is in the
early stages of planning to replace 25 30' Orion coaches. Subject to successful
prototype testing, Muni will purchase either CNG or diesel-electric hybrid
buses to replace these coaches. VI.
Accommodate maintenance
of vehicles fueled by lighter than air fuel through the redesign of Islais
Creek maintenance facility and part of the Woods maintenance facility Subject
to availability of funds, Muni will re-engineer the final design of the
proposed Islais Creek maintenance facility and retrofit part of the existing
Woods maintenance facility to accommodate fueling and related infrastructure
required to operate motor coaches fueled by lighter than air fuels (e.g.,
natural gas, hydrogen, etc.). It
is expected that the next significant change in transit bus technology will be
toward hydrogen-based fuel cells and that this change could occur within a
decade. Since the Islais Creek maintenance facility is projected to serve Muni
for 30 to 50 years, re-engineering of the final facility design to accommodate
lighter than air fuels is considered cost-effective. Muni
is in the process of applying for funds for preliminary facility engineering
and design for incorporation of CNG technology. These federal and state funds,
whose funding cycles begin annually in March, can be used either for conversion
of an existing facility or re-design of Muni's future facility, Islais Creek. VII.
Develop electric trolley
coach expansion plan Although
the initial capital investment in the overhead system for electric trolley
buses is high, there are future life-cycle savings due to the less costly
operation of trolley coaches (reduced maintenance and power expenses) and the
longer life expectancy of the trolley coaches. There are also environmental
benefits associated with trolley coach operation, especially with respect to
pollution and noise reduction. Muni
will develop an electrification plan and timeline for converting up to 6 bus
lines and report at least annually to the Transportation Authority regarding
progress on planning and implementation. Muni's
analysis determines 2006 as being an aggressive and optimistic timeline for a
line to be electrified and in revenue service. The Transportation Authority and
the environmental coalition will prioritize identifying funding and
participating in building community support for electrification of bus lines. VIII.
Participate in a fuel
cell pilot program Due
to the fact that approximately half of Muni's fleet is electrified, Muni is not
currently required to participate in a fuel cell bus pilot program under
California Air Resources Board rules for transit agencies, despite having
selected the diesel path under CARB rules. Muni
will participate in a fuel cell pilot program, either through the Fuel Cell
Partnership or in cooperation with AC Transit within 24 months pending
resolution of funding questions. IX.
Deploy the cleanest
alternative fuel and/or diesel buses in neighborhoods most afflicted by
multiple pollutant sources In recognition
of the significant levels of pollution afflicting several San Francisco
neighborhoods, Muni will deploy its cleanest alternative fuel and/or diesel
buses fitted with particulate traps in the most seriously polluted
neighborhoods. All neighborhoods will eventually benefit from substantially
cleaner bus technology. X.
Determine ways that the health needs in the Bayview
Hunters Point communities can be
incorporated into future transportation planning Muni
will work in close cooperation with the Department of Public Health, the
Department of the Environment, community leaders, and advocates from the
Bayview Hunters Point communities to develop a set of health-based criteria to
be used by planners and community representatives as an evaluation metric for
clean air transit strategies. Muni will also identify desirable transit
alternatives not provided by existing services that could meet community health
needs and work with community leaders and advocates to advertise and market
future improvements to public transportation in this area. XI. Retrofit diesel buses purchased since 1997 with particulate traps
and convert to low-sulfur diesel fuel by the end of 2002 Under the diesel fuel path requirements of CARB Transit Bus Emissions Regulations,
Muni would normally be required to install particulate traps on its entire diesel
fleet by the end of 2007. Under this agreement, Muni will retrofit diesel buses
purchased since 1997 with particulate traps and convert to low-sulfur diesel fuel
by the end of 2002. DEFINITIONS,
ACRONYMS, AND ABBREVIATIONS AFFTaC:
(Muni) Alternative Fuels Facility Taskforce Committee. AFPP: Alternative Fuel Pilot Program. ASME: American Society of Mechanical
Engineers. Bki: Bevilacqua-Knight, Inc. BTU: British Thermal Units of energy. CARB: California Air Resources Board. CARB-2
diesel fuel: Defined as ~120 ppm
sulfur content. CaTTS: California Truck Testing Services;
chassis dynamometer. cfm: Cubic feet per minute. CHP: California Highway Patrol. Clean-diesel: Industry term for 1997 and newer
4-cycle diesel engines. CNG: Compressed Natural Gas. CO: Carbon monoxide. Cummins: Cummins Engine Company, Inc. dBA: Decibels measured on the A-weighted
sound level scale. DDC: Detroit
Diesel Corporation. DGE: Diesel Gallon energy Equivalent. Dwell: Amount of time spent with doors open at
bus stop. ENRG: ENRG Clean Transportation. Failure: Any event requiring a road call or
forfeit of passenger service. FTA: Federal Transit Administration. GGE: Gasoline Gallon energy Equivalent. Grade: The percent inclination of a hill. GVW: Gross Vehicle Weight; total maximum
allowable vehicle weight (bus+load). Hybrid: Electric motor, batteries, and internal
combustion engine Combined
as one propulsion system package. In-use: In reference to data that is collected
while vehicle is in service. IOC: Independent Oversight Committee for
AFPP. ITS: Institute of Transportation Studies at
the University of California,
Davis. Kirkland: Muni motor coach division on North
Point at Stockton. LFL: Lower Flammability Limit. LNG: Liquid Natural Gas. Marin
Street: Muni motor coach division
on Marin Street at Indiana. MDBF: Mean distance between failures. MPH: Miles per hour. SFMTA: Municipal Transportation Agency. MTC: Metropolitan Transportation Commission. Muni: San Francisco Municipal Railway. NABI: North American Bus Industries. Neoplan:
Neoplan USA Corporation bus manufacturer. NOx: Oxides of nitrogen. Opacity: Measurement of exhaust or smoke visual
quality. Orion: Orion Bus Industries. Parallax: Measurement-taking error caused by
reading an analog dial from
a side, rather than directly in front. Pinnacle: Pinnacle Natural Gas Co. PM: Exhaust Particulate Matter; also
Periodic Maintenance. ppm: Parts per million. Propulsion
system: Engine and either motor or
transmission that together
power the vehicle's drive wheels. Protractor: Device used to measure angles and
grades. psi: Pounds per square inch pressure. Regenerative
braking: Electric braking that
supplements the mechanical/foundation
brakes. Road
call: Vehicle on-road failure
preventing continuation of service. Run: Set of specific trip times on a specific
line. SAE: Society of Automotive Engineers. SFCTA: San Francisco County Transportation
Authority. SFFD: San Francisco Fire Department. SFPD: San Francisco Police Department. SOC: State of charge for the hybrid bus
propulsion batteries. Specific
gravity: Weight of a gas or liquid
relative to air or water. Terminal
speed: Maximum speed at which
vehicle accelerate equals zero. Transparent: When vehicle is thought to be
indistinguishable to operator,
operations, or during maintenance procedures from other similar
vehicles. Trillium: Trillium USA. Turnkey: Ready for immediate use. UC
Davis: University of California at
Davis. ULSD: Ultra Low Sulfur Diesel fuel. Ultra-capacitor: Electrical energy storage device
sometimes used in place
of batteries. UFL: Upper Flammability Limit. USGS: United States Geological Survey. Woods: Muni motor coach division on Indiana
Street between 22nd and 23rd Streets. 30-foot
bus: Muni 9000 Series. Standard coach mainly used in narrow residential
areas. 40-foot
bus: Muni 8000, 8100, 8200, 8800,
8900, 9200 Series. Standard coach
making up majority of Muni bus fleet. 60-foot
bus: Muni 6200, 6300 Series. Articulated coach easily identified
by "accordion" middle section. An Acrobat PDF (400kb) version of
Appendix C will allow you to view slides more easily. Notes: Driving cycles are speed-time traces
that represent vehicle operation.
Differences in facilities and vehicle design (i.e., vehicle weight,
engine size, and programming) result in variation between our findings and
others, however, results from other alternative vehicle projects are presented
to confirm that the results are reasonable Notes: The CBD is a geometric cycle that
consists of 14 identical peaks.
Each peak is an acceleration to 20mph, a cruise, and then a deceleration
to idle. The cycle is approximately 2 miles long, takes 600 seconds to
complete, and has an average speed of 12.6 mph. The severe decelerations are not typical of the Muni
operations we observed thus far.
The CBD Cycle may not reflect real-world hybrid bus performance because
regenerative braking that may occur in reality (i.e. during slower
decelerations) does not take place during the CBD Cycle's steep decelerations. Notes: Closer but still not SF. The New York Bus Cycle (NY Bus) was
developed from speed-time data collected from heavy-duty vehicles (both trucks
and transit buses) in New York City, but the cycle was statistically generated
using Monte Carlo simulation. This cycle (Figure 2) is 571 seconds in length,
covers a distance of approximately 0.6 miles, and has an average speed of 3.7
mph. Although this average speed
is lower than we observed for San Francisco, the NY Bus Cycle does offer a
variety of acceleration and deceleration rates more typical of in-use
operation. These rates are less
severe than those in the CBD, which allows the regenerative braking system of
hybrid vehicles to capture vehicle inertial energy. Notes: San Francisco has unique terrain and
operating characteristics that are not reflected in either the NY Bus or CBD
Cycles. Driving cycles were
created specifically for San Francisco by collecting vehicle characteristics
(e.g. vehicle speed, engine speed, and power) from the alternative fueled buses
operating on three Muni routes. The data were obtained by logging engine
data bus signals via the communications ports in the buses. Data were collected on three routes at
non-peak times on weekdays. Traffic counts were used to verify that the traffic
conditions were similar for each data collection. Three sections of the route
data were selected which represented diverse Muni bus operations. One route
section was relatively flat with high pedestrian concentrations and frequent
stops and starts. The second
section had long, steep upgrades with few stops. The third route section was dominated by moderate downgrades
and had few stops. Note: All averages for replications on
tests. So each point varies by
factor of 4. Note: Two tests not are not enough. A larger average is needed. Notes: Fuel economy was compared on the basis of
diesel fuel consumption in units of miles per gallon. In order
to compare the fuel economy of the CNG bus, CNG fuel consumption was converted
to diesel gallons equivalent using a conversion factor of 137 cubic feet of
natural gas per gallon of diesel fuel.
Fuel economy from the diesel bus and the diesel bus with trap were
expected to be similar since properly operating traps do not affect fuel
economy. The results of the SF 3-
Route Cycle are consistent with this.
However, the buses with traps were more than 20% less efficient on the
NY Bus Cycle. This decrease in
fuel economy may be attributed to sulfur in the fuel interfering with the traps
and creating a backpressure. Muni
is in the process of switching to a low sulfur fuel which will enable optimal
performance of the particulate traps.
Currently, Muni does use CARB 2 diesel fuel which has a sulfur level of
120 ppm or less. That fuel was run
through the buses when they were tested, but the residual sulfur was in the
trap. It is possible that the
levels of sulfur in the trap differed between the tests on the buses with the
diesel than on the diesel with trap. Notes: Fuel economy was compared on the basis
of diesel fuel consumption in units of miles per gallon. In order to compare
the fuel economy of the CNG bus, CNG fuel consumption was converted to diesel
gallons equivalent using a conversion factor of 137 cubic feet of natural gas
per gallon of diesel fuel. Fuel economy
from the diesel bus and the diesel bus with trap were expected to be similar
since properly operating traps do not affect fuel economy. The results of the SF 3- Route Cycle
are consistent with this. However,
the buses with traps were more than 20% less efficient on the NY Bus
Cycle. This decrease in fuel
economy may be attributed to sulfur in the fuel interfering with the traps and
creating a backpressure. Muni is
in the process of switching to a low sulfur fuel which will enable optimal
performance of the particulate traps.
Muni recently converted from using CARB-2 diesel fuel which has a sulfur
level of 120 ppm or less. That
fuel was not run through the buses when they were tested, but the residual
sulfur was in the trap. It is
possible that the levels of sulfur in the trap differed between the tests on
the buses with the diesel than on the diesel with trap. [1] The
heavy-duty chassis dynamometer in Richmond, CA. is one of five such facilities
in North America. [2] The
Hyde Street cable car line has Muni’s most extreme grade at 21%. Motor coaches are expected to operate
on this line if cable car operation is not possible. [3] Faster and slower running times impact operating
costs. For example, a bus that
runs on hilly lines (19, 23, 29, 44,48,and 54 lines) and completes its run time
6% faster than scheduled saves $3.2 million annually compared to a bus that
runs 5% slower on those same lines.
A bus that runs 6% faster on flat lines (2, 17, 23, 28, 47, and 88
lines) saves $2.3 million annually compared to a bus that runs 5% slower on
those same lines. A detailed
analysis of this and other operating costs is found in this report’s Cost:
Operating Cost section. [4] This data is consistent with testing undertaken by
the Sacramento Regional Transit District. [5] Muni will be testing the effects of Exhaust Gas Recirculation
(EGR) equipment on emissions and fuel economy on 15 of its conventional diesel
buses, in 2002-03. The Bay Area
Air Quality Management District (BAAQMD) recently awarded Muni a grant to test
the efficacy of NOx reduction equipment (EGRs) and PM filters on these 15 Muni buses. [6] Survey results are based on a very limited sample
of 18 surveys and follow up discussions with passengers. [7] All service
reliability statistics are based on the first 6 months that all buses were in
service at Muni, regardless of the model year of the bus. Muni did not compare the service
reliability of new 2001 buses to broken-in 1999 buses. Instead, Muni used service reliability
data for the 1999 NABI conventional diesels, based on records from their
initial 6 months in service with Muni. [8] Fuel
evaluations were made by converting natural gas into its diesel gallon energy
equivalent. [9]
Technology specific maintenance is defined as any maintenance activity
pertaining to the propulsion and fuel systems of the vehicles, as well as any
other subsystem associated with these areas. [10] Muni
paid approximately $320,000 for each of its newest Neoplan coaches. A PM filter would cost approximately
$10,000. [11] The
BAAQMD recently approve a grant for Muni to test EGR technology on 15 of its
conventional diesel buses. [12] Source:
John Haake, Southwest
Regional Sales Manager of Orion Bus Industries, 707-838-8352. Mr. Haake also stated that with larger
quantities or when production becomes standard the pricing should be between
$385,000-425,000. [13] The Regional account funds alternative fuel
vehicles but not infrastructure. [14] Boston and Cleveland have similar concerns with CNG
buses passing under overhead trolley wires. In those cities, the probability of a hazardous event
occurring on a system that is working within design specifications has been
assessed as “4C” by the US Department of Transportation Federal Transit
Administration’s Office of Safety and Security rating on mil-std-992D, using
standard hazard assessment evaluation techniques. [15] For
example, the large gasoline fuel tanker trucks that one can find throughout San
Francisco have greater potential for damage if targeted. It should also be noted that New York’s
CNG buses still operate daily, but security for all facilities has been
increased. [16] New
York City tested alternative bus technologies on its streets for two years
before deciding to include a combination in their fleet. [17] The
AFPP Independent Oversight Committee (IOC) and program timeline were
established through Supervisor Ammiano’s office as part of the 11-point
agreement. See Appendix A. [18] 2004
California Air Resources Board (CARB) engine emissions certification standards,
specifically NOx levels, may not be met by diesel powered engines used
conventionally. Furthermore, it is
unclear whether either natural gas or diesel fuel, used in a conventional
transit bus, will be able to meet 2007+ standards. At a certain point, neither fuel will be able to meet CARB
emissions standards, since any form of an internal combustion engine cannot be
considered zero-emission – which is where vehicle emissions standards are
headed. [19] The
Trillium USA CNG fuel station at San Francisco International Airport, and the
Olympian/ENRG fueling station on 3rd Street at 23rd
Street are the only local facilities capable of the high pressures required for
Muni’s CNG buses while allowing adequate vehicle accessibility. [20] One
pair of NABI buses remains unmodified in order to provide a control group for
the study. It should be noted that
while Muni’s 2000 Neoplan standard diesel buses are more current than the NABI
buses, they were not available for testing purposes when the AFPP began. Now that they are available, it is
recommended that they be used as the AFPP control group. However, note that the 2000 Neoplan
diesels and 1999 NABI diesel engines are covered by the same CARB emissions
certification standards. [21] The
California Truck Testing Services (CaTTS) heavy-duty chassis dynamometer in
Richmond, CA. is one of five such facilities in North America. [22] PM is
the term used for a mixture of solid particles and liquid droplets found in the
air. These particles can cause
health problems in the respiratory system. [23] NOx,
is gas that reacts with carbon monoxide and hydrocarbons to form smog. Long-term exposure to NO2
may cause lung problems. NOx also
contributes to the formation of acid rain. [24] Carbon
monoxide (CO) is an odorless, colorless gas that interferes with the delivery
of oxygen in the blood to the rest of the body. It is produced by the incomplete combustion of fuels. CO combines with NOx and hydrocarbons
(HC) to create smog. [25]
Driving cycles are speed-time traces that represent vehicle operation. [26] State
of charge (SOC) is a parameter related to the hybrid batteries. SOC must be the same at the beginning
and end of an emissions cycle, or else corrected for in the final analysis of
that cycle. [27] Survey
results are based on a very limited sample of 18 surveys and follow up
discussions with passengers. [28] Ultra
low sulfur diesel (ULSD) has sulfur content of ~15 ppm or less. The California Air Resources Board
(CARB) has mandated its use by transit agencies by July 1, 2002. Muni converted in January 2002. [29] Excess
sulfur (due to Muni’s previous use of 120 ppm sulfur diesel fuel before
converting to ~15 ppm ultra low sulfur diesel fuel) is actually cooked off of
the filter elements by the manufacturers in order to ensure optimized
emissions, fuel economy, and exhaust opacity results with ULSD fuel. [30]
Setting the machine to manual trigger may help to capture the data. [31] This
is the lowest measured level during testing. [32] The
engine-transmission layout on both CNG and diesel bus technologies is
considered a conventional motor coach layout, as opposed to the hybrid
technology, which offers sound reduction due to its use of a
small-engine/generator/electric motor layout. [33]
Streetside is the driver’s side of the bus. Curbside is the side of the bus with passenger doors. [34] The
hold feature allows the instrument to capture the highest noise level reading
during testing, rather than dynamic readings. [35] This
is the most extreme acceleration test grade. [36] Since
engine power and torque curves are almost identical between the control group
buses and the CNG buses, and axle ratio for the CNG bus is less, the difference
in performance is likely a function of the extra 3000 pounds that the CNG bus
carries in fuel storage. Note that
Liguid Natural Gas (LNG) vehicles virtually eliminate this weight differential. [37] Hyde
Street between Bay and Francisco. [38] These
high grades are not served by motor coaches during normal operation. This is due to the superior hill
climbing ability of both cable cars and electric trolley coaches. However, motor coaches are required to
operate on these lines during a power outage, prolonged street blockage or any
activity that removes required cable car or trolley bus street
infrastructure. For example: cable
or track maintenance, or overhead trolley wire work. [39] If vehicle
speed is less than 55 mph, then the vehicle is at its limit prior to taking top
speed data for this grade. [40] If
vehicle speed is less than 45 mph, then the vehicle is at its limit prior to
taking top speed data on this grade. [41] All
vehicle weights are based on full fuel loads. An average passenger weight is assumed to be 150
pounds. [42] Muni’s
free New Year’s Eve service is an example of holiday operation where extreme
passenger loads are common. [43]
Extreme grades are found on the Potrero Hill and Hunter’s Point sections
of the 19-Polk line. [44] See
previous section of this report: Emissions: Tailpipe Exhaust Emissions. In theory, the on-road and dynamometer
numbers should have been closer.
Work is being done to identify possible reasons for this discrepancy. Perhaps this is the difference between
the laboratory and actual in-use data.
Other possible explanations could be that the sulfated PM filters could
have influenced fuel economy differently as they became more and more “clogged”
with ~120 ppm sulfur fuel (the fuel economy data was taken months before the
chassis dynamometer tests).
Furthermore, other studies have shown hybrid buses to be as fuel
efficient, or more so, than the other technologies. Since both chassis dynamometer and on-road results found the
hybrids to be in between conventional diesel and CNG technologies, additional
data is clearly called for here. [45] Ultra
low sulfur diesel fuel. CARB has
mandated its use by July 1, 2002 for all transit agencies running diesel fueled
buses. [46] See
the discussion of diesel gallon equivalents of energy (dge) in this report’s
Evaluation Criteria section 6.2. [47] Fuel
economy data for the hybrids is based upon limited data due to interrupted data
collection. [48] The
CNG buses carry 24,000 scf of gas, as opposed to the 18,000 scf most CNG buses
carry. Therefore, Muni considers
this to be the maximum possible range for this bus configuration, since there’s
simply no more room for more fuel storage on the roof. However, 390 miles is more than adequate
range, and in fact, could possibly be reduced in order to reduce vehicle
weight. Likewise, hybrid range can
be increased from 300 miles by specifying a larger fuel tank. [49] Once
reaching about 200 psi primary fuel supply pressure, the CNG buses would
experience ever-decreasing power for a short distance before final fuel
starvation. [50] Range
data for the hybrids is based upon limited data due to an interruption during
data collection. [51] A
larger response to the surveys is clearly required during the remaining AFPP. [52] Hybrid
buses do not have transmissions, and therefore, do not shift gears. Hybrid bus speed varies proportionally
with the speed of its drive motor.
This same motor allows for regenerative (electric) braking, which helps
to provide smoother deceleration. [53]
Chassis issues and comments regarding systems not related to CNG or
hybrid technology were omitted. [54] Note
that while this comment seems to contradict the 81.9 dBA rear seat area noise
level measured on the hybrid buses, it is agreed that the rear seat area seems
too loud qualitatively. See this
report’s section on Emissions: Vehicle Noise Levels. [55]
Eighteen (18) test surveys were administered by the preliminary survey
designer. The trend assumptions above are his alone and based heavily on the
follow-up conversations with riders on the alternative technology vehicles.
These assumptions have not been statistically justified given the limited data
collected. [56] NYCT
Operating Experience with Hybrid Transit Buses, as presented at the SAE Truck
and Bus Meeting in Chicago, November 13, 2001. NYCT Experience with Clean Fuel Technologies, as
presented at the World Bank Sustainable Transport Meeting , January 16, 2002. [57] All
vehicle weights are based on full fuel loads. An average passenger weight is assumed to be 150
pounds. [58] 1999
NABI conventional diesel reliability rates are based on records from their
initial 6 months in service with Muni. [59] Local
Lodge #1414 - International Association of Machinists and Aerospace Workers. Contact John Moran, Business
Representative/Organizer, 800-231-1305. [60] Ultra
low sulfur diesel, mandated by California Air Resources Board by July 1, 2002. [61] Hybrid
propulsion system battery is still being determined. New hybrid bus products may use ultracapacitors in place of
the propulsion systems batteries found on Muni’s hybrids. These devices should not require
replacement at the same rate as conventional batteries. [62] Diesel
Gallon Equivalent of energy. [63] Hybrid
and PM filter bus MPG numbers reflect the fact that these vehicles may have had
low fuel economy due to Muni’s previous use of ~120 ppm sulfur diesel fuel,
which may have caused additional exhaust backpressure in the PM filters of
these vehicles due to the PM filters not completely burning off the excess
sulfur after Muni converted to ~15 ppm ultra low sulfur diesel fuel. [64] Hybrid
fuel economy based is on ~150 mile data set. Data collection was interrupted
during the hybrid evaluation of fuel economy. The hybrid data represents only the short-term fuel economy
of the hybrid buses, so fuel cost per mile is estimated based on this limited
data. [65] See
Appendix A. [66] Source
of vehicle cost information: Orion Bus Industries, John Haake, Southwest
Regional Manager (707-838-8352).
Source for incremental facility cost information: Muni Alternative Fuels
Facility Taskforce Committee (AFFTaC). [67] A fuel
cell derives energy from a fuel source such as hydrogen and provides it as
electricity. The by-product from
the process of combining hydrogen fuel with oxygen to provide electricity is H2O
(steam). [68] Muni’s
entire fleet of 1999 and newer diesel buses will be retrofitted with PM filters
within the next year. The PM
filters are mandated by CARB for 1996 and newer diesel buses beginning in 2005. [69]
Estimate based on including all related costs in addition to hardware. [70] See
the Facility Compliance section of this report. [71] See
this report’s Safety section summary. [72]
According to PG&E, the Trillium USA CNG facility at SFO is similar
in size to one that would be necessary to serve 80 transit buses. PG&E’s charge to connect their
natural gas transmission system was approximately $18,000. It should be noted that these charges
are dependent on a number of factors which have yet to be determined. Muni will need to submit a formal
request for service before PG&E can developed even order of magnitude costs
for the project. Actual costs are
dependent on site, distance to PG&E main, and capacity of main, and are
being evaluated for the Islais site; cost may be rolled into a 3rd-party
gas provider contract. PG&E
information provided by Bill Zeller, PG&E Clean Air Transportation
department (415-257-3353). [73] This
retrofit is estimated to be 50% more costly than incremental capital costs
associated with building a new facility. [74]
Storage of large volumes of natural gas may not be feasible in San
Francisco. [75] See
Appendix A, point IV. [76]
$0.04-$0.10 per therm to pump and compress gas, based on LAMTA data,
equates to roughly $0.05-$0.13 per DGE. [77] No
third-party provider surveyed discussed tying price of gas to price of
diesel. Assumptions: Average Muni
bus travels 90 miles per day; 36 DGE per CNG coach daily (avg); 65 of 80
coaches would be in service on weekdays and weekends, as preferred alternative
technology vehicles; 854,100 DGE consumed annually by an 80-coach CNG fleet. [78]
Natural gas has a specific gravity 0.6 vs. 1.0 for air. [79]
The flammability range for natural gas is 5-15% by volume. [80]
Note that this list is a general guideline, not design criteria. [81]
Facility compliance summary and results primarily based on February 1,
2001 analysis report on Muni’s Woods Division maintenance area by Yazeed
Khayyat, Manager, Advanced Bus Technologies, Parsons Brinckerhoff Transit &
Rail Systems, Inc. (973-565-4891). [82] See
this report’s section: Cost: Capital Cost. [83] For
example, the large gasoline fuel tanker trucks that one can find throughout San
Francisco have greater destructive potential as a target. It should also be noted that New York’s
CNG buses still operate daily.
However, the New York Police Department (NYPD) has expressed concern
over CNG buses and facilities.
Security for all transit facilities has been increased in the New York
City area. NY information provided
by Dana Lowell, Assistant Chief Maintenance Officer, R&D, Dept. of Buses,
New York City Transit (718-927-8629).
A strong pre-trip
inspection program, sound safety critical items purchased with the bus and
hardening of fueling areas as well as the main CNG feeds will help to mitigate
potential terrorist issues. Once
this is accomplished, operator training is the key issue. The concern is along the lines of a
bomb strapped to the CNG tanks themselves, which can generally be controlled
with good security and inspection procedures. It should be noted that Israel, while having a significant
problem with bus bombings in general, has not had a problem with their CNG
buses. This could be because
terrorists do not target them (it is more difficult to produce the intense fire
that is generated with a diesel fuel burn after the initial explosion) or that
more intense pre-trip inspections are performed on CNG buses prior to roll out,
and they limit the CNG buses to "safe" routes. The San Francisco concern is more
related to the fueling areas and fuel storage areas (cascade area), as well as
the main CNG service feed into the property. These areas are less protected and would create a larger
impact than a single vehicle. [84] United
States Geological Survey report "The Loma Prieta Earthquake of October 17,
1989." [85] The
108 Treasure Island line operates inside the Transbay Terminal. [86]
Boston and Cleveland have similar concerns with CNG buses passing under
overhead trolley wires. In those
cities, the probability of a hazardous event occurring on a system that is
working within design specifications has been assessed as “4C,” based on US
Department of Transportation Federal Transit Administration Office of Safety
and Security rating on mil-std-882D, using standard hazard assessment evaluation
techniques> The 4C rating
states that in terms of both vehicle and system, a trolley wire related CNG bus
hazardous event may occur at some time in the life of an individual bus, and
may occur several times in the life of the electric trolley wire system. However, the hazard severity would be
negligible, with less than minor injury, less than minor system damage, and
less than minor environmental damage.
A San Francisco specific evaluation by proper outside authorities is
recommended. [87]
Kerry Witt, Golden Gate Bridge Manager (415-921-5858) [88]
Richard Olander, Superintendent of Maintenance for the Bay Bridge
(510-286-6956) [89]
On 4rd Street near King Street [90]
On 3rd Street near Cesar Chavez Street [91]
Philip Tellis, Senior Stationary Engineer for the Bureau of Street and
Sewer Repair (415-695-2032) [92]
It should be noted that the five (5) CNG powered Presidio “PresidiGo”
Shuttles use this tunnel as part of their normal green-line service. These shuttles are 29-foot, 24
passenger vehicles. Mark
Helmbrecht, Presidio Trust (415-561-5300).
http://www.presidiotrust.gov/shuttle/ [93]
Comments made informally in 8/14/2001 email between instructor James
Tucci (TSI) and student Marty Mellera (Muni) during a follow up to a Natural
Gas Safety Course put on by the Federal Transportation Safety Institute (TSI). [94] Gas
accumulation under the cupola housing is a concern, so the cupola housing
should be vented to prevent gas accumulation and provided with a monitoring
system to prevent accumulation from reaching the LFL through the bus
procurement specifications. [95] These
comments are based on an explanation of the “4C” hazard rating referenced in
footnote #72. More frequent cylinder inspection and leak detection
monitors in the tank storage bays of the buses should be put in place,
particularly if trolley wire relocation or route avoidance are not possible. [96]
San Francisco Fire Department report “Operations of the San Francisco
Fire Department Following the Earthquake and Fire of October 17, 1989.” Frederick F. Postel, Chief of Department. Compiled and Edited by Dave Fowler, October 17, 1990. [97] United States Geological Survey report
"The Loma Prieta Earthquake of October 17, 1989." |
|||||||||||||||||||||||||||||||||||||||||||||||||||||||||||||||||||||||||||||||||||||||||||||||||||||||||||||||||||||||||||||||||||||||||||||||||||||||||||||||||||||||||||||||||||||||||||||||||||||||||||||||||||||||||||||||||||||||||||||||||||||||||||||||||||||||||||||||||||||||||||||||||||||||||||||||||||||||||||||||||||||
©2000-2013 San Francisco Municipal Transportation Agency. All rights reserved. |

