This is the archival website for the San Francisco Municipal Transportation Agency (SFMTA). It is not kept up to date. Please visit the SFMTA website for current information. parent page > SFCTA Agreement Status Report | |||||||||||||||||||||||||||||||||||||||||||||||||||||||||||||||||||||||||||||||||||||||||||||||||||||||||||||||||||||||||||||||||||||||||||||||||||||||||||||||||||||||||||||||||||||||||||||||||||||||||||||||||||||||||||||||||||||||||||||||||||||||||||||||||||||||||||||||||||||||||||||||||||||||||||||||||||||||||||||||||||||||||||||||||||||||||||||||||||||||||||||||||||||||||||||||||||||||||||||||||||||||||||||||||||||||||||||||||||||||||||||||||||||||||||||||||||||||||||||||||||||||||||||||||||||||||||||||||||||||||||||||||||||||||||||||||||||||||||||||||||||||||||||||||||||||||||||||||||||||||||||||||||||||||||||||||||||||||||||||||||||||||||||||||||||||||||||||||||||||||||||||||||||||||||||||||||||||||||||||||||||||||||||||||||||||||||||||||||||||||||||||||||||||||||||||||||||||||||||||||||||||||||||||||||||||||||||||||||||||||||||||||||||||||||||||||||||||||||||||||||||||||||||||||||||||||||||||||||||||||||||||||||||||||||||||||||||||||||||||||||||||||||||||||||||||||||||||||||||||
Muni's Clean Air InitiativesStatus Report of the Eleven-Point Agreement with the San Francisco County Transportation Authority Res. 01-08 Working Draft Capital Planning & Legislative Affairs Division May 2002 Table of ContentsOther Clean Air Initiatives at Muni Appendix A: Muni Bus Purchase Proposal Appendix B: Test Results for Four Types of Advanced Technology Buses Appendix C: Fiscal Impacts on Variable Operating Costs, Given Different Running Times Appendix D: Request for Information on Costs of Building a CNG Fueling Facility Appendix E: Comments to Proposed Revisions to TFCA Funding
|
| Point | Requirement | Status |
|---|---|---|
| 1 | Purchase 95 diesel coaches; defer purchase of 80 | Complete; 95 Neoplan coaches will be received by beginning of 2003. |
| 2 | Commence alternative fuel pilot program (AFPP) | Phase I complete; Phase II to conclude in July 2003. |
| 3 | Develop specifications for CNG or hybrid buses | Draft complete; undergoing internal review. |
| 4 | Acquire minimum of 15 CNG buses, subject to conditions | Conditions have not yet been met. $3.5 million dollars in grant funds have been secured to date, leaving a shortfall of approximately $8.5 million for capital costs associated with Islais and Woods facilities. Subject to satisfactory results of Alternative Fuel Pilot Program. |
| 5 | Replace 30' Orions with CNG or hybrids | Subject to results of Alternative Fuel Pilot Program. |
| 6 | Re-design Islais Creek and retrofit Woods, subject to availability of funds | A CNG fueling station has been incorporated into preliminary
engineering at Islais. The current alt-fuel facilities funding shortfall
is $9 million.[2]
Capital cost estimates associated with a CNG facility:
Total incremental capital cost for Islais: 6.9M Redundant facility at Woods: $5.0M |
| 7 | Develop electric trolley coach expansion plan | Draft plan is complete. The zero-emissions Third Street Light Rail will replace some diesel coaches on #15 line. Active discussions are ongoing on Potrero Hill. Also, Muni has identified electrification as a priority, subject to community acceptance and funding availability. |
| 8 | Participate in a fuel-cell program | Muni will observe and report on fuel cell technology tests conducted by Bay Area transit agencies when they begin in 2003. Fuel cell program stalled in the Bay Area due to unavailability of technology. AC Transit recently signed an agreement for the purchase of three fuel cell buses. |
| 9 | Deploy cleanest buses to neighborhoods with multiple pollutant sources | Complete. Newest buses were assigned to routes in Bayview, Hunters Point, and Potrero Hill. CNG and hybrids from the AFPP will be used on pilot "Bayview Special" line to Civic Center Farmer's Market and General Hospital. |
| 10 | Incorporate health needs of Bayview/HP neighborhoods into transportation planning | Over the past year, Muni has been a key participant on the City's Bayview Health Task Force. One action that came out of the task force was the creation of Muni's new "Bayview Special" service. The 78 Line will bring residents to farmers' market, hospital, grocery store and gym. In the summer of 2001, Muni also solicited suggestions for improvement from a group of employees who live in the Bayview and Hunters Point neighborhoods. |
| 11 | Install soot traps and convert to ultra-low sulfur fuel (ULSD) by 1/03 | Muni has secured approx. $4.5M for PM trap retrofits and is aggressively seeking local match funding for the remaining $2M required. Muni converted to ULSD in January 2002. |
In conclusion, most of the projects called for in the 11 points have been advanced substantially or completed:
- Muni acquired 95 new clean diesel buses.
- Phase One of the Alternative Fuels Pilot Program (AFPP) concluded in March 2002. The results of Phase One can be found in the Muni staff report, "Alternative Fuels Pilot Program, Phase One Review." According to the researchers of University of California, Davis who created the test plan, the results of Phase One are inconclusive. The final phase is scheduled for completion in July 2003.
- Muni's Fleet Engineering Section has drafted specifications for CNG and hybrid coaches.
- Muni has requested a $1.5 million Congressional FY03 earmark for alternative fuel buses.
- Muni created an Alternative Fuels Facility Task Force to investigate the facilities implications of investing in CNG. Preliminary work is currently underway at Islais, although there is facilities funding shortfall of $9 million.
- Muni's Capital Planning and Legislative Affairs Division has drafted a trolley coach expansion plan, currently scheduled for management review in April 2002. The first diesel replacement is scheduled to occur in 2004, when the zero-emissions Third Street Light Rail line is scheduled to replace some of the #15 diesel coach line in 2005. Active discussions are underway on Potrero Hill regarding electrification.
- In 2003, Muni will observe and report on a fuel cell pilot program with other Bay Area operators, subject to regional and industry progress on fuel cell technology development.
- Muni deployed its cleanest buses to the Bayview, Hunters Point, and Potrero Hill neighborhoods, which are afflicted by multiple pollutant sources.
- In response to health concerns, Muni is initiating a pilot bus service which will provide Bayview residents with better access to organic fruits and vegetables, health services, a grocery store and a gym. Service began in May 2002.
- Muni converted to ultra-low sulfur diesel starting in January 2002, six months before the CARB deadline and one year before the SFCTA deadline.
The only projects that await completion are those for which full funding has not been secured, or those that await the final results of the AFPP. Muni has aggressively sought funding for all of the clean air initiatives, but still faces a shortfall in funding for a CNG facility and for retrofitting its 375 diesel coaches with particulate matter (PM) traps. Muni's efforts to seek funding are described later in this report.
The emissions testing conducted in the first six months of Phase One should be continued in order to achieve more meaningful results. The second phase of Muni's Alternative Fuel Pilot Program is scheduled for completion in July 2003, when Muni expects more conclusive findings from UC Davis than the preliminary findings of Phase One.
Commitment to Clean Air
The San Francisco Municipal Railway (Muni) is committed to reducing air pollution in San Francisco. One of the most significant ways that Muni helps to reduce pollution is to provide safe, reliable public transportation. With more people on transit, fewer cars on the road mean less pollution. Muni also demonstrates its commitment to clean air by operating zero-emission and low-emission vehicles. Fifty-three percent of Muni's active revenue fleet is pollution-free, including 203 rail vehicles and 332 electric trolley buses, that generate zero pollution. Forty percent of Muni's buses are zero-emission buses. Almost all of the electricity on which those vehicles run is generated by hydropower, a clean source of energy. Most of the diesel buses in Muni's fleet are new, and thus generate fewer emissions. By December 31, 2002, Muni's older diesel buses will be rebuilt with kits that reduce soot emissions.[4] The diesel buses that have not been rebuilt will be retired from the active fleet. In 2002, Muni will install NOx-reduction equipment on 15 of its diesel buses.[5] Muni operates 18 vehicles that are powered by compressed natural gas (CNG)[6] in its non-revenue fleet. Muni is continuously seeking new ways to reduce pollution.
Air Quality Regulations
Some of the Muni's clean air initiatives are influenced by air quality laws. Air quality is regulated by federal, state, and local authorities. Muni is subject to air quality laws, regulations, and conditions promulgated by the Environmental Protection Agency (EPA) and California Air Resources Board (CARB), among other entities. The EPA is responsible for enforcing federal air-quality laws. CARB executes California's air quality laws through regulations. The CARB regulation that figures most prominently in this report is the Transit Bus Fleet Rule ("CARB Rule"), promulgated in 2001.[7] The CARB Rule mandated that all transit agencies in the state comply with a variety of deadlines to achieve pollution reduction in their active fleets. The CARB emission standards dealt with oxides of nitrogen (NOx), particulate matter (PM), carbon monoxide (CO), and hydrocarbons (HC).
The CARB Rule allowed transit agencies to choose the path by which they would achieve the emissions reductions. In January 2001, 62% of California transit operators, including Muni, chose the diesel path over the alternative fuel path. [8] In choosing the diesel path, Muni became subject to more rigorous deadlines than agencies that chose the alternative fuel path. A summary of Muni's current obligations follows:
CARB Requirements
| Date | Requirement | Obligation Fulfilled | Notes |
|---|---|---|---|
| July 2002 | Low sulfur diesel fuel | Yes | Purchased in January 2002 |
| October 2002 | NOx fleet average 4.8 g/bhp-hr[9] | Yes | Achieved in advance of CARB mandate[10] |
| 2003-2007 | PM retrofits[11] | Pending funding.[12] | |
| January 2004 | New CA diesel engine standards | Applies to new buses delivered in 2004-2006. | |
| January 2007 | New federal engine standards | Applies to new buses purchased in 2007. |
The deadlines that CARB set in its regulation are designed to reduce four different types of pollution. These pollutants were studied in Phase One of Muni's Alternative Fuel Pilot Program:
Oxides of Nitrogen
The reduction of oxides of nitrogen (NOx) and particulate matter (PM) from motor vehicles continues to be a major focus in air pollution regulation in California.
These pollutants are of particular concern because of their impacts on human health. NOx, which forms when nitrogen in the air is burned during fuel combustion, is a primary contributor to smog. Smog is associated with a variety of respiratory ailments. Current diesel engines typically have higher NOx emissions than CNG engines. Preliminary data from testing on the streets of San Francisco demonstrated that diesel engines emit roughly 7.4 g/bhp-hr NOx. By contrast, in on-road testing, CNG buses emitted roughly 4.9 g/bhp/hr NOx g/bhp-hr.[13]
Particulate matter
With PM, the primary health and environmental concerns are respiratory illnesses including asthma, and heart disease. Long-term exposure to PM can increase the risk of dying from lung cancer, according to a study in the March 2002 Journal of American Medical Association. Diesel particulate is widely acknowledged to be a dangerous airborne Toxic Air Contaminant and is recognized as a carcinogen by numerous national and international agencies, including the International Agency for Research on Cancer, the U.S. Environmental Protection Agency, the National Toxicology Program, and CARB. It accounts for nearly 70% of the airborne cancer risk in the state of California.
Carbon Monoxide
Though the CARB regulations do not focus as much on carbon monoxide (CO), this too is a regulated byproduct of combustion. The CO emissions of all buses are significantly below the EPA standard of 15.5 g/bhp-hr. These emissions are only a concern when a group of buses are idling on lots or in maintenance facilities.
Hydrocarbons
The final regulated pollutant, hydrocarbons (HC), is a byproduct of the incomplete combustion of fossil fuels and is produced from both diesel and natural gas engines. Health and environmental effects of HC pollution include the formation of smog, as well as potentially toxic effects from certain hydrocarbon compounds. Diesel engines are usually thought to produce greater levels of HC than CNG engines, but this may only be the case for non-methane hydrocarbons. CNG emissions including methane may or may not be lower than diesel engines depending on the quality and composition of the natural gas, which can vary by supplier. Methane is considered a potent contributor to global warming.
Muni's vehicles are not a major source of the pollutants that are targeted by the CARB regulation. According to an emission inventory published by CARB, in 2001 all buses (including Muni and other transit agencies operating in San Francisco, as well as private tour and shuttle operators) operating in the city of San Francisco contributed 7% of the total NOx from mobile sources in the city.
Although emissions from Muni's transit vehicles are small compared to other sources, Muni has continued to take steps to reduce pollution in its fleet. Some of Muni's clean-air initiatives were supported by the Muni/SFCTA 11-Point Agreement. Other projects, such as a pilot program to install NOx-reduction equipment, have been initiated by Muni. The remainder of this report details the status of the projects in the 11-Point Agreement
Muni/SFCTA Agreement
The 11-Point Agreement is a set of negotiated actions, led by Board of Supervisors President Tom Ammiano, to SFCTA Resolution 01-08, which authorized Muni to purchase 95 diesel motor coaches in March 2001. The purpose of those actions was to explore the feasibility of alternative fuels and to continue to reduce emissions and improve air quality. Most of the projects called for in the eleven points have been initiated, including the highlight of the eleven points, Phase One of the Alternative Fuels Pilot Program (AFPP). The 11-Point Agreement includes:
1. Purchasing 95 buses and deferring the purchase of 80;
2. Starting Phase One of the Alternative Fuels Pilot Program;
3. Developing specifications for alternative fuel buses;
4. Acquiring 15 CNG buses, subject to conditions;
5. Replacing 30' Orion buses with CNG or hybrid;
6. Creating or retrofitting fueling and maintenance facilities to accommodate CNG;
7. Developing an electric trolley coach expansion plan;
8. Participating in a fuel cell pilot program;
9. Deploying the cleanest-fuel vehicles to neighborhoods with multiple pollutants;
10. Incorporating the health needs of Bayview residents into transportation planning;
11. Installing particulate traps on buses and converting to ultra-low sulfur diesel;
The remainder of this document details action that Muni has taken to fulfill
the eleven points. (Language in italics is taken from the
11-Point Agreement, found in Appendix A.)
Point One: I. Approve purchase of 95 diesel buses; defer purchase
of 80 buses
Muni will purchase 24 60' articulated buses and an additional 71 standard 40' diesel coaches under this plan. Muni will defer the purchase of the remaining 80 diesel buses pending the outcome of prototype testing of compressed natural gas (CNG) and diesel hybrid-electric motor coaches.
In 2001 Muni exercised an option to purchase 95 forty-foot diesel motor coaches from Neoplan. All of the coaches will be received by 2003. On May 21, 2002 the Director of Transportation will report to the Municipal Transportation Agency Board (MTAB) on the results of Phase One of the prototype testing. The final phase of testing is scheduled to conclude in July 2003.
Point Two: II. Commence prototype testing of 2 CNG and 2 hybrid-electric
buses to inform the purchase of 80 40-foot coaches
Muni will commence prototype testing of 2 CNG and 2 diesel-electric hybrid buses, with independent oversight by the Department of the Environment, an independent consultant and a peer review panel with representatives from transit agencies that successfully operate CNG buses. The prototype program will last for 8 months prior to issuance of the resulting RFP for the purchase of 40-foot coaches (3/01-10/01)[14]; prototype testing will continue for an additional 18 months thereafter.
The preliminary results of the AFPP indicate that Muni should continue its testing program. Detailed results of the AFPP are available in a separate Muni staff report, "Alternative Fuel Pilot Program: Initial 6-Month Evaluation Results."
The University of California at Davis - Institute of Transportation Studies (ITS) was contracted by Muni to compare the emissions and energy efficiency of the different AFPP technologies. This comparison was primarily made with a chassis dynamometer[15] using an ITS-designed San Francisco simulation which, for the first time, tested heavy duty vehicle emissions on hills. Results of this testing are found in the UC Davis-ITS Preliminary Chassis Dynamometer Test Results for Four Types of Advanced Technology Buses presentation, attached as Appendix B.
ITS and Muni evaluated CNG, hybrid, exhaust after-treatment (PM filter), and conventional diesel vehicle technologies during their initial six months in revenue service. San Francisco's unique and challenging transit environment, including the City's famous hills, and commitment to "transit-first" principles required an on-sight evaluation as well as "laboratory" testing on the chassis dynamometer.
The test buses were compared to unmodified conventional diesel buses in 19 different categories. These categories are further grouped below into the general areas of: emissions; performance; operations; maintenance; cost; and safety concerns.
Emissions
Tailpipe emissions
Researchers at the Institute of Transportation Studies, University of California Davis analyzed the Phase One emissions testing which took place over a period of 6 months. Testing will continue until the full program concludes, in July 2003. ITS-Davis staff explained that testing of advanced technology buses is a complex and evolving science. The tests conducted for Muni thus far were intended to 1) confirm that results were consistent with those reported by other advanced bus technology testing programs and 2) facilitate development of new tests suited to San Francisco's unique terrain and driving conditions. With these caveats, UC Davis offered the following preliminary results of based on the standard emissions tests:
- the magnitude of emissions were generally consistent with those found in other studies of advanced technology buses operating,
- as is typical of emissions testing, there was a large range of emissions values for each bus,
- the hybrid, CNG, and diesel buses with traps offered greatly reduced PM emissions compared to conventional diesel buses,
- PM emission of CNG, hybrid, and diesel bus with trap were similar and sometimes at the detectable limits of the analyzers,
- the CNG buses demonstrated the lowest NOx emissions followed by the hybrid and diesel buses,
- the diesel buses exhibited the best fuel economy and the CNG bus the poorest; unlike other testing, the hybrid bus had poorer fuel economy than the diesel; this can be attributed to the diesel's unexpectedly high fuel economy.
San Francisco's unique grade and operations characteristics (such as average speed and idling duration) are not captured in the traditional test cycles discussed above. Therefore, ITS-Davis created a preliminary SF specific test cycle using bus speed and road grade information collected on three diverse Muni routes. Limited testing on the SF Cycle indicates that the fuel economy differences between buses may be less in SF than predicted by the conventional cycles.
There were several test protocol difficulties that need to be addressed with California Truck Testing Services, the contracted emissions testing facility, prior to the next round of testing. The testing that was conducted in the first six months of Phase One is insufficient to recommend one type of alternative fuel over another. The staff of ITS-Davis recommends that more testing is required over the remaining months of the pilot program, in order to achieve more meaningful results. Comprehensive bus operations and topography data collection could commence in July 2002, and the next round of emissions testing would occur in October 2002.
Visual quality of exhaust
Vehicle exhaust odor was not noticeable by passengers on any of the AFPP buses. Exhaust opacity, or visual quality, was outstanding on all of the technologies.
Vehicle noise levels
Exterior noise was significantly lower on the Hybrids. In general, interior noise was lowest on the Hybrids and CNG buses. PM filters lowered the interior and exterior noise levels of the conventional diesels.
Performance
Performance indicators included top speed and acceleration on different grades, average time between stops, fuel economy, and fuel range. Grades of up to 21% were used in these performance evaluations.[16] The following performance indicators were observed:
1) Hybrid buses accelerated faster than any of the other technologies, regardless of grade. In general, the PM filter buses have the best top speed performance on all grades, followed by the CNG buses. Preliminary results indicate that particulate filters did not degrade service of conventional diesels.
2) In challenging operating conditions hybrids gained time on each line trip, while the CNG buses lost time compared to the diesel buses.[17]
3) The PM filter buses have the best fuel economy and range. The CNG buses are the least fuel efficient, and hybrid buses have the shortest fuel range.[18],[19]
Operations
Both operators and passengers were surveyed informally for their opinions regarding the alternative technologies. The data is qualitative and received from a small number of operators and riders. A more formal, comprehensive survey will be completed in Phase II of testing.
- Operators of the AFPP buses preferred the PM filter buses. However,
hybrids were said to be smoother while performing just as well. Both CNG
and hybrid buses were said to have better braking. In general, operators
did not feel that CNG buses were well-suited for hills or high passenger loads.
- Riders want dependable service first and foremost, but would prefer to ride clean-fuel buses whenever possible. Riders are generally concerned with all kinds of emissions, but don't view Muni as a major source of pollution. Most riders feel that a different fuel source probably means a cleaner burning engine.[20]
Maintenance
Muni moves the equivalent of San Francisco's entire population every day. Vehicle reliability is crucial.
1) During their initial 6 months in operation, the PM filter buses were four (4) times more reliable than CNG buses, and 10 times more reliable than the hybrids.[21] The PM filter buses accumulated more than three (3) times the mileage during their first 6 months compared to the CNG and hybrid buses, partly due to the relatively low reliability rates found so far in the alternative technologies. Six months is not a sufficient time period in which to test reliability.
2) Mechanics working on the AFPP felt that maintenance issues could be resolved as their knowledge of the new technology improved.
Cost
Ongoing operational costs and onetime capital costs were analyzed. Operational costs include fuel[22] and technology-specific maintenance.[23] For the purposes of this report both are calculated in terms of cost per mile. Capital costs include the incremental cost of the vehicles and necessary fueling and facility modifications.
1) Fuel only cost per mile is highest for the CNG buses, and lowest for the PM filter buses. Technology-specific maintenance costs were also highest for the CNG buses and significantly lowest for the PM filter buses. Combining fuel and maintenance costs produce the same results.
2) Conventional diesel buses with PM filters cost approximately $330,000.[24] Hybrids currently cost about $120-170,000 more per bus than a diesel bus with PM trap. CNG buses cost approximately $15-30,000 more per bus than diesel buses with PM traps. In order to meet CARB emissions standards in 2004, diesel buses must be equipped with aftertreatment technology that will reduce NOx. The aftertreatment technology that Muni will be testing (EGR) costs approximately $10,000 for each bus.[25] According to bus manufacturer Orion Industries, the range of CNG buses can be between $345-360,000 depending on variables. The cost of CNG buses has dropped as more buses are being manufactured. An order of 15 hybrid buses would cost approximately 450-500,000 at this time. The price is expected to decline as the technology gains popularity.[26] Currently, there are 34 hybrid buses in operation in the United States. In the state of California, eight are in operation, including the two that Muni owns. In January 2002, Muni requested a federal earmark of $1.5 million for the purchase of alternative fuel buses in the FY03 Congressional appropriations process. Two other sources of funding are the Program Manager and Regional Funds from the Transportation Fund for Clean Air. Any public agency can apply for funds from these sources. The Program Manager fund contains approximately $950,000. Muni received $500,000 from this fund in FY02 for CNG facilities. Regional funds total approximately $8 million, but individual annual grants cannot exceed $1 million. Muni will be submitting an application for funding from the Regional account in May/June 2002.[27]
3) None of Muni's current facilities are safety compliant with CNG buses. Fueling and maintenance facilities must be specifically tailored for CNG. To support a fleet larger than 15 CNG buses, Muni would need to spend roughly $6.9 million for capital costs associated with one facility. For additional capacity, Muni would need to spend an additional $5 million, bringing the total cost to $11.9 million for capital costs associated with modifications to two facilities. However, one facility could provide enough capacity for a large purchase of CNG buses. Capital costs associated with facility modifications for a large purchase of Hybrid buses would be about $1.05 million.
Safety
The safety category is primarily concerned with the hazards of CNG vehicle operation on bridges, through tunnels, under electric trolley wires, and inside terminals. Secondary concerns include threats from intentional harm, and earthquake conditions.
-
Hazards
In general, the hazard potential from CNG buses during operation is extremely low. However, it is strongly recommended that certain areas be evaluated further. Other areas include streets with low trolley wires, where the possibility of an explosion exists in which an errant wire may strike a CNG tank on the top of a passing bus.[28] Hazards in long tunnels such as Broadway and Stockton present other areas for further evaluation. A comprehensive safety evaluation and certification must be in place before the procurement of CNG buses or modification of facilities.
-
Terrorism
Muni buses operate around City Hall, the Federal Building, the United Nations plaza, the TransAmerica Building, and on the Golden Gate Bridge, which may be considered terrorist targets for various reasons. Given the volatility of CNG relative to diesel fuel, CNG buses could be considered a target for terrorism.[29]
- Earthquakes
The US Geological Survey states that there is a 67% probability that San Francisco will one day experience another Richter-magnitude 7 earthquake. During the 1989 Loma Prieta earthquake, electricity was not available, and natural gas supplies were unreliable in San Francisco. Fifty-three percent of Muni's entire fleet is currently electric powered. In the event of an emergency, with gas and electric supplies cut or reduced, a reliable fuel source will be crucial. The Independent Oversight Committee has suggested that the use of liquefied natural gas (LNG) would obviate the risk of service interruption in the event of an earthquake. San Francisco's solid waste hauler, NorCal Waste Systems is in the process of converting its fleet to LNG.
Summary
The preliminary results of the AFPP indicate that Muni should continue its testing program. The past six months of testing has yielded preliminary, and not reliable, emissions results.[30] Muni may also consider the testing of new technologies, such as LNG, the use of oxidation catalysts, and other aftertreatments in Phase Two of testing.
Muni should also consider the impact of regulations on its future procurements. California is mandating new emissions standards in 2004-2006. Even more stringent regulations will be imposed in 2007 by the federal Environmental Protection Agency. Natural gas buses do meet the 2004 CARB mandate. Currently, neither conventional nor hybrid diesel buses meet the 2004 mandate although aftertreatment technology may enable diesel buses to meet the new standards. Diesel, hybrid, and CNG currently do not meet 2007 standards.
Point Three: III. Commence specification and procurement
by developing an RFP for 80 CNG or diesel-electric hybrid buses
Concurrent with the prototype testing, Muni will begin developing specifications and an RFP for 80 CNG or diesel-electric hybrid 40-foot coaches.
If prototype testing is successful, CNG or diesel-electric hybrid buses will be operated along the following proposed routes which Muni has determined offer the best topography and service levels for these technologies: lines 2, 16AX/BX, 17, 23, 28, 47, 80X, 81X, 82X, 88, 89.
Muni's research has found that agencies with lower ridership and lighter duty cycles are generally more successful with CNG technology. Agencies with high ridership and heavy urban duty cycles have been less successful; these agencies consistently cite higher-than-anticipated operating and maintenance costs for CNG technology.
This research supports Muni's assertion that a comprehensive testing of CNG and diesel-electric hybrid technology in the San Francisco operating environment is essential prior to making a commitment to invest in CNG or diesel-electric vehicles and infrastructure.
Muni's Fleet Engineering Division has drafted specifications for CNG and hybrid
buses, however, testing should continue before making a decision on an alternative
fuel technology because of testing uncertainties.[31]
Point Four: IV. Acquire a minimum of 15 CNG 40-foot coaches
for revenue service, subject to satisfactory completion of prototype testing and
acquisition of fueling infrastructure
To gain revenue service experience with lighter than air alternative fuels, Muni will purchase a minimum of 15 CNG 40-foot coaches for in-service use, subject to satisfactory completion of prototype testing and acquisition of fueling infrastructure. Installation of fueling infrastructure must be free, with guarantees of CNG fuel at or below the cost of diesel or the Transportation Authority must identify funding for fueling infrastructure.
If prototype testing of CNG and diesel-electric hybrid coaches indicates the same reliability and the minimum conditions described above are met, Muni will favor the purchase of CNG buses for the remaining 65 40' coaches; otherwise Muni will seek Transportation Authority and Board of Supervisors approval to purchase 65 40' diesel-electric hybrid buses. Muni will only approach the Transportation Authority seeking approval of the option to purchase 80 diesel coaches in the event that prototype testing fails.
For safety reasons, CNG requires special fueling and maintenance infrastructure. If Muni were to purchase a sizeable number of buses - 80 for example - Muni's maintenance facilities must first be retrofitted with rounded ceilings, gas detection systems, and other safety equipment before taking delivery of CNG buses. If Muni purchased a smaller fleet of 15 or less, Muni may obviate the requirements of CNG maintenance infrastructure. In the case of a small fleet, each bus could be stored outside, then de-gassed into the air and towed indoors to a standard bay for maintenance. At this time, the underlying conditions of Point 4 have not been met for the following reasons:
Successful prototype testing has not been completed. Phase One of testing yielded results that are not reliable, and Phase Two of testing is scheduled for completion in July 2003.
Fueling infrastructure will not be free. Fueling infrastructure
will not be free, though with more investigation and discussion with companies
the costs might be reduced through special programs that would amortize the costs
over a certain period of years. In December 2001, Muni issued a Request
for Information (RFI) to vendors who provide CNG-related services. Muni
also sent an RFI to the president of the California Natural Gas Vehicle Coalition,
who indicated he would post the announcement. ENRG, Trillium USA, Pinnacle
CNG, Bevilacqua-Knight, and PG&E all responded to Muni's RFI, and all stated
that they would charge a fee for their services. The following table is
a summary of responses. Copies of the RFI and responses are available in
Appendix C.
| Name of Firm | Approx Facility Cost | Fuel Cost/Diesel Gallon Equivalent (DGE) | Time to Construct | Comment |
|---|---|---|---|---|
| ENRG | $750K - $1.25M | No cost provided; project cost amortized over a 10-year fueling agreement. | 6-9 mo (independent of the larger facility project) + 6-9 MO Muni review, safety cert & approval cycle= 12-18 months total | 750-1000 DGE/hr delivery = 5-6 min fill time per bus; minimum 30-to-80-bus fleet for ENRG to participate |
| Trillium USA | $4.5M | 33 - 68 per DGE for ops & maintenance + amortized purchase cost & profit; appears not to include electric power, @ 5-13/DGE; 56/DGE gasA. Commodity cost: 61 - 69 / DGEB | 7 MO (assuming no Muni special requirements, soil conditions or unforeseen conditions) + 6-9 MO Muni review, safety cert & approval cycle= 13-16 months total | 80-bus fleet, 5 min fill time per bus, 3 lanes |
| Pinnacle CNG Co. | $2M | 44-to-85 per DGE to operate & maintain the facility, + amortized purchase cost & profit; depends on volume pumped & other factors ($375,804 - $725,985 annual cost); price does NOT include gasB or electric power | 6-12 MO (assuming no special site coordination difficulties) + 6-9 MO Muni review, safety cert & approval cycle = 12-21 months total | 80-bus fleet; assumes 5 min fill time per bus; number of fuel lanes not indicated. |
| Trillium USA | $1.5M | N/A | 15-bus fleet; assumes slower timed fill rate for night servicing. | |
| Pinnacle CNG Co. | $500K | N/A | 15-bus fleet; assumes 45 minute fill time per bus | |
| PG&E Clean Air Transportation | N/A | N/A | N/A | Do not build turnkey facilities |
| Bevilacqua Knight, Inc. | N/A | N/A | 7-14 months + 6-9 MO Muni cycle = 13-23 MO total | Do not build turnkey facilities |
A: 4 - 10 per therm to pump & compress gas, based on LAMTA data, equates to 5 - 13 per DGE.
B: No firm surveyed discussed tying price of gas to price of diesel.
Sufficient funding has not been identified. Major modifications must be made to maintenance facilities in order to safely fuel, maintain, and store CNG buses. Facilities must be created and/or retrofitted in order to accommodate the special safety and maintenance requirements of CNG. The rough order of magnitude (ROM) incremental capital costs associated with a fueling and maintenance facility at Islais Creek is estimated to be $7 million. The cost of retrofitting the existing Woods facility with CNG infrastructure is $5 million. To date, only $3.5 million in funding has been identified for CNG infrastructure. By comparison, the ROM incremental capital cost of upgrading an existing Muni facility to hybrid is just over $1 million. A comparison of the cost of investing in a CNG or hybrid facility, compared to a diesel facility follows in Figure 3:
Figure 3
INCREMENTAL Capital Costs Over a Conventional Diesel Facility
| Item | CNG | Hybrid |
|---|---|---|
| Maintenance Facility (16 Maintenance Bays) | $1.25 | 0.8 |
| Fueling Facility (3 Fuel lanes) | $3.75 | 0.0 |
| Design Consultant contract for CNG at Islais (both Maint & Fueling) | $0.5 | 0.0 |
| PG&E hookup | (TBD)* | 0.0 |
| Degassing Station (for 1 coach at a time) | $0.3M | 0.0 |
| Safety Certification | $0.5M | $0.1M |
| Employee training (stationary engineers or a new class) | $0.5M | $0.1M |
| Battery conditioner | 0.0 | $0.05M |
| Service vehicles | $0.1M | 0.0 |
| SUBTOTAL Incremental Capital Cost for Islais | $6.9M | $1.05M |
| Redundant fuel station @Woods[32] | $5.0m | 0.0 |
| TOTAL Incremental Capital Cost for both Islais + Woods | $11.9M | $1.05M |
| Natural Gas Storage tank | TBD** | 0.0 |
*Actual costs are dependent on site, distance to PG&E main, and capacity of main, and are being evaluated for the Islais site; cost may be rolled into a third-party gas provider contract.
**Gas storage subject to community approval.
These cost estimates are based in part on information that Muni staff received following a visit to Sacramento Regional Transit's fueling and maintenance facility. Muni created a multi-division Alternative Fuels Facility Task Force to research the facilities implications of investing in CNG technology. That task force traveled to Sacramento to learn about that agency's CNG experience: In 1992, Sacramento retrofitted a 49,000 square-foot maintenance facility and built a 12,000 square-foot CNG fueling facility with four fueling bays. Sacramento paid $7.7 million ($3.8 million in 1992 and $3.9 million in 1999) for its CNG facility. Many services and some infrastructure costs were not included in that figure because they were donated. PG&E donated several services including engineering reviews of its facility modifications and engineering reviews of its fueling facility. PG&E also installed a gas line to PG&E's high pressure main pro bono.[33] The current cost of such a line is approximately $1 million per mile.
Muni has aggressively sought funding for alternative fuel infrastructure. To date, Muni has applied for $7 million in federal earmarks[34] and local grant funds. Muni has been awarded $3.5 million, including the most recent award from the Transportation Authority's TFCA FY02/03 Program Manager Fund.
Additional capital funding for the incremental costs of CNG vehicles and support appears to be limited, and Muni's existing capital program does not have a funding surplus. So, any shift in priorities to accommodate new projects into the existing program would result in current projects being deleted. A summary of potential funding opportunities is provided in the following table. These are the same sources of funding that other transit agencies have used to fund their alternative fuel programs.
Potential Sources of Capital Funding: Federal, State and Local
| Potential Capital Funding Source, FEDERAL | Potential Additional Funding to Muni for AFVs and Support | Comments |
|---|---|---|
| TEA-21 Section 5307 | $0 | Program is 100% obligated until expiration of TEA-21. Muni would need to revise existing capital program (i.e. delete current projects from the program) to accommodate new priorities. |
| TEA-21 Section 5308 Clean Fuels | $0 | Congress has earmarked all funding for this program; no discretionary funds are available. |
| Congestion Mitigation Air Quality /Surface Transportation Program | $0 | Program is 100% obligated by MTC. No new funding is available until 2003/04. |
| Department of Energy Clean Cities | $0 | Clean Cities does not provide direct funding to cities. |
| TEA-21 Section 5309 | Subject to political approval process. | Muni requested $1.5 million in FY03 for alternative fuel buses |
| Potential Capital Funding Source, STATE | Potential Additional Funding to Muni for AFVs and Support | Comments |
|---|---|---|
| Governor's Transportation Congestion Relief Plan | $0 | Funds for alternative fuel vehicles in the Bay Area are restricted to the Regional Express Bus program, for which urban buses are not eligible. |
| Carl Moyer Heavy Duty Engine Program | $3.9 million region-wide in 2002. | Local BAAQMD awards funding through competitive process based on cost-effectiveness of emission reduction project. Private sector may also apply. Funding is only for incremental costs of vehicle engines. |
| Carl Moyer Advanced Technology Program | $0 | Funds are for engine technology R&D prior to commercialization. |
| Carl Moyer Fuel Infrastructure Program | $2 million statewide | Very competitive; private sector can also apply. |
| Other funding programs | $6 million statewide | Very competitive; private sector can also apply. |
| Potential Capital Funding Source, LOCAL | Potential Additional Funding to Muni for AFVs and Support | Comments |
|---|---|---|
| Transportation Fund for Clean Air (TFCA) Regional Funds - Bay Area Air Quality Management District | $8 million region-wide in FY00/01,
$1 million cap per project per year |
Highly competitive - any public agency in 9-county region can apply. Current BAAQMD policy is to support infrastructure only for electric recharging not CNG facilities. |
| TFCA Program Manager Funds - CCSF Transportation Authority | $700,000 to
$1 million County-wide annually |
Competitive - any public agency in County of San Francisco can apply. Program is designed for small, innovative pilot projects. |
| CCSF Proposition B | $0 | Program is 100% obligated until expiration of Prop B. Muni would need to revise existing capital program (i.e. delete current projects from the program) to accommodate new priorities. |
Sources: TEA-21, Muni Capital Improvement Program, Department of Energy Clean Cities Program, CARB, BAAQMD, MTC, SF County Transportation Authority.
When the issue of CNG funding first surfaced in 2000, it was suggested to Muni that $215 million in state funds were available for Muni to use in purchasing alternative fuel buses. After further research, staff found that the funds referred to are part of the Governor's Traffic Congestion Relief Plan (TCRP) and were earmarked for specific programs at other transit agencies. It should be noted that Muni received $140 million for Third Street Light Rail's Initial Operating Segment and Central Subway. Muni also received $10 million in TCRP funds for Ocean Avenue/Balboa Park improvements.
A summary of funds that Muni has received for CNG facilities follows:
| Fund Source | Amount | Date applied | Status | Notes |
|---|---|---|---|---|
| SFCTA: TFCA Program Manager Funds FY01 | $500,000 | March 7, 2001 | AWARDED: $500,000 | $500,000 will pay for the conceptual engineering report. An additional $5 million is required for the incremental additional cost for a CNG facility compared to a diesel-only facility. |
| SFCTA: TFCA Program Manager Funds FY02 | Applied for $950,000; Received $500,000 | February 26, 2002 | AWARDED: $500,000 | |
| Federal 2002 Earmark Sec. 5309 | $3.9 million total for PM traps and CNG facilities | April 2001 | AWARDED: $3.9 M (to be allocated to PM traps and CNG) | Requires $780,000 local match. $3.9 million is TOTAL amount for PM traps and CNG facility. |
| Federal 2003 Earmark Sec. 5309 | Requested $1.5 million for alternative fuel buses | January 2002 | Pending Congressional appropriation processes. | Appropriations decision expected in Fall 2002. |
Other transit agencies, notably Sacramento, Sonoma, San Diego and Los Angeles have incorporated CNG into their transit fleet. Below is a list and description of the funds they have used to purchase CNG vehicles and fund infrastructure.
A summary of funds that other transit agencies have received for CNG vehicles and facilities follows:
| Transit Agency | Alt Fuel Equipment | Funds |
|---|---|---|
|
San Diego |
CNG Fueling Infrastructure | San Diego Gas and Electric paid for initial infrastructure, with the transit
agency paying for fuel costs.
Later upgrades were paid for with TCRP funds, funds from the San Diego AQMD 2766 funds (car registration), and some Federal section 5307 funds. |
|
Sonoma
|
CNG Fueling Infrastructure and CNG Vehicles | Funding for the facilities came from Federal section 5307 funds ($1 million)
and from BAAQMD and State TDA (combined to fill the balance). At that time,
BAAQMD Regional Funds could be used for CNG infrastructure.
PG&E paid Sonoma $10k/bus for their original order of 15 buses in 1996. |
|
Los Angeles |
CNG Fueling Infrastructure | For most of the stations that LA SFMTA funded themselves (i.e. not the public-private
partnerships), they primarily used federal Congestion Mitigation for Air Quality
(CMAQ) funds. They also used South Coast AQMD funds. These were matched
by state TDA, STA, and some local sales tax funds. Los Angeles also used
some federal formula funds.
For the facilities built with partnerships (such as with Trillium), Los Angeles has been using CMAQ funds to pay for the ongoing facility leases. When the CMAQ funds run out they expect to use federal formula funds. |
|
Sacramento |
CNG Fueling Infrastructure | Total initial improvements cost $3.85 million. Of this PG&E funded
$0.5 million directly, and provided $0.1 million in engineering services.
PG&E also installed a high pressure gas line to the facility at no cost to
Sacramento. Of the $3.85, $3.08 was funded federally, and $0.77 million
funded from state and local sources. The remaining costs were funded with
TDA funds.
Sacramento upgraded their facilities in 1999 for$3.9 million. Eighty percent of this was also funded federally. The remaining costs were made up from state and local sources. |
San Diego Metropolitan Transit Development Board (MTDB)
San Diego has 295 CNG buses in their fleet. They have been operating CNG since 1994 when they received 97 buses, followed by 27 more in 1997 and 165 in 2001. They also operate 112 diesel buses which will be retired in 2-3 years and replaced with CNG. They also operate 63 artic diesels with no plans to retire these.
Fueling Facilities and Funding
San Diego operates CNG out of 3 main divisions. One smaller municipal operator in their region (Chula Vista) also uses CNG buses.
The fueling stations were originally built and paid for by San Diego Gas & Electric. MTDB paid nothing up front and then paid for fuel costs, similar to other turn-key projects. (SDGE has sold the stations to Pickens (now ENRG).) The original projects included the stations, compressors, metering, and tie-in to the main pipeline. The gas lines in the street were upgraded by SDGE when the stations were built, again at their own cost. Initial costs were estimated at $1-1.2 million per facility.
MTDB is now in the process of expanding the stations for greater capacity, including increasing the horsepower of the compressors, adding dispensers, and adding backup generators in case of electric power failures. These expansions are expected to cost about $2m each. Funding for these expansions is from the Governor's Traffic Congestion Relief Plan, some funds from the San Diego AQMD 2766 funds (car registration), and some from section 5307. They have been able to use the SDGE funding of the original stations as local match for the federal funds.
Maintenance Facilities
San Diego had to do some upgrades to the maintenance areas when they converted to CNG. However, because of the mild climate, they do not have enclosed service bays, so costs are probably lower than for facilities in less temperate climates.
The Kearny Mesa facility was retrofitted in 1995 for $160,000. The SB Maintenance facility was rebuilt in 1995 for approximately $300,000.
The Imperial Division, which is the largest accommodating 175 buses, was also rebuilt in 2000. The old building was demolished and a new facility built, for a total of $10 million. Approximately $500,000 was related to CNG upgrade costs.
Sonoma Transit
Sonoma built their facility in 1994-5 for a cost of $1.8-2.0 million. This covered the fueling station and ventilation modifications to their shops. A pipeline was built to tie in with the PG&E main gas line 1/2 mile away, for a cost of $150-200,000. Sonoma owns the line, which saves them on gas transmission charges; current cost is about 2-3 cents/therm.
Funding for the facilities came from Federal 5307 funds ($1 million) and from BAAQMD and State TDA (combined to fill the balance). At that time, BAAQMD Regional Funds could be used for CNG infrastructure. They did not receive any PG&E funding for the facilities, though PG&E did give Sonoma $10k/bus for their original order of 15 buses in 1996.
Los Angeles SFMTA
For the first facility Los Angeles built, they used FTA discretionary funds matched with South Coast AQMD funds.
For most of the stations that LA SFMTA funded themselves (i.e. not the public-private partnerships), they primarily used federal Congestion Mitigation for Air Quality (CMAQ) funds. These were matched by state TDA, STA, and some local sales tax funds (Prop C in Los Angeles). Los Angeles also used some federal formula funds.
For the facilities built with partnerships (such as with Trillium), Los Angeles has been using CMAQ funds to pay for the ongoing facility leases. When the CMAQ funds run out they expect to use federal formula funds.
Sacramento RT
The original fueling facility and shop modifications for Sacramento cost $3.1 million for the facility and $0.75 million for related facility modifications, mostly added ventilation and methane detection. Total improvements cost $3.85 million. Of this PG&E funded $0.5 million directly, and provided $0.1 million in engineering services. PG&E also installed a high pressure gas line to the facility at no cost to Sacramento. This reduced the size and therefore the cost of the compressors required.
Of the $3.85, $3.08 was funded federally, and $0.77 million funded from state and local sources. PG&E's direct contribution which counted as a local match. The remaining costs were funded with TDA funds.
Sacramento upgraded their facilities in 1999 for$3.9 million. Eighty percent of this was also funded federally. The remaining costs were made up from state and local sources.
Point 5: V. Purchase CNG or diesel-electric hybrid coaches
to replace 30' Orion motor coaches, contingent on successful prototype testing.
Muni is in the early stages of planning to replace 25 30' Orion coaches. Subject to successful prototype testing, Muni will purchase either CNG or diesel-electric hybrid buses to replace these coaches.
As described above, the emissions data from Muni's pilot program is preliminary. More conclusive data is needed before making a decision to purchase CNG or hybrid buses.
Point 6: -VI. Accommodate maintenance of vehicles fueled by lighter than air fuel through the redesign of Islais Creek maintenance facility and part of the Woods maintenance facility
Subject to availability of funds, Muni will re-engineer the final design of the proposed Islais Creek maintenance facility and retrofit part of the existing Woods maintenance facility to accommodate fueling and related infrastructure required to operate motor coaches fueled by lighter than air fuels (e.g., natural gas, hydrogen, etc.).
It is expected that the next significant change in transit bus technology will be toward hydrogen-based fuel cells and that this change could occur within a decade. Since the Islais Creek maintenance facility is projected to serve Muni for 30 to 50 years, re-engineering of the final facility design to accommodate lighter than air fuels is considered cost-effective.
Muni is in the process of applying for funds for preliminary facility engineering and design for incorporation of CNG technology. These federal and state funds, whose funding cycles begin annually in March, can be used either for conversion of an existing facility or redesign of Muni's future facility, Islais Creek.
In December 2001, Muni selected a consulting engineer to incorporate a CNG facility into the preliminary engineering at Islais Creek. The work is proceeding, while Muni considers other issues related to CNG facilities, particularly timing, funding, safety, and environmental justice.
Timing
An operational maintenance facility designed for lighter-than-air fuels is required before Muni can maintain a sizeable fleet of CNG coaches.[35] The two potential CNG facilities that the 11-Point Agreement identifies are the future Islais Creek and Woods. Islais Creek is currently scheduled for construction, beginning in 2003. An optimistic schedule for construction of the Islais Creek Facility follows:
- May '03 - May '04: Site Preparation (contingent on land procurement from CalTrans)
- June '04 - November '05: 18-MO Facility Construction (contingent on bridging $15M funding shortfall)
- December '05 - May '06: Punchlist work, Safety Certification, Training, Move-In
- June '06: Start of Revenue Service
Funding
As described in Point Four, sufficient funding for the fueling and maintenance of CNG has not been established. The cost of constructing and retrofitting facilities at Islais Creek and Woods is about $12 million. This cost includes the installation of fueling and maintenance infrastructure, safety modifications, and the implementation of safety and security programs. By contrast, the cost of facility modifications for hybrid buses would be about $1 million.
Muni has received about $3.5 million in grant funding, leaving a deficit of $8.5 million. As the explanation of Point Four also states, the prospects for more funding are limited, and no vendors of CNG-related services will provide their services for free. In contrast, PG&E provided Sacramento Regional Transit pro bono services including engineering reviews. PG&E also installed a gas line to its high pressure main at no cost to Sacramento Regional Transit.[36]
Safety
Muni's safety representatives conducted a preliminary safety review of CNG facilities requirements. The safety representatives' recommendation was that all safety issues be addressed prior to the acquisition of the CNG fleet and final design of the CNG facility. These representatives also advised that further comprehensive operational hazard analysis will likely identify additional safety issues. These issues may involve policy considerations, resources, and funds needed to mitigate identified hazards. The safety requirements that were identified include:
- Completion of a preliminary Operational Hazard Analysis as soon as possible.
The analysis must include, as a minimum: fleet, facility, and system integration
elements including city infrastructure and operational requirements. The
analysis should also include, as a minimum: CNG gas ventilation in tunnels, citywide
network of overhead trolley wires, and CNG gas ventilation in facility.
- Development of a Safety Certification program for the fleet, facility and
integration of the CNG equipment and systems. Timing of the safety certification
is critical. If the CNG facility is not certified at the time the CNG bus
certification is approved, then additional safety requirements must be developed
and certified in order to support the safe operation of the CNG bus fleet
- Establishment of the necessary minimum employee qualifications and necessary
security requirements.
- Establishment of the necessary security requirements and development of
a Security Certification program.
- Re-evaluation of the safety risk of electric wire/CNG. Based
on Muni's current usage and volume of its overhead line system and support structure,
the safety representatives strongly recommended the reevaluation of the federal
Department of Transportation's classification of an electric wire/CNG risk as
"4C."[37] Muni has a
formal risk assessment program in place for Third Street Light Rail project and
Metro East facility that should be the basis for a formal risk assessment of this
issue.
- Coordination of Emergency Response. An assessment of city emergency response resources should be incorporated into the overall hazard analysis along with the safety certification program.
This list is not intended to be exhaustive. Further issues may present themselves in the remaining 18 months of the AFPP. Safety representatives will add new requirements to this list as the need arises.
Environmental Justice
The CNG facility at a public transit agency in San Bernardino has been the target of recent environmental justice legislation in the California Senate. Natural gas leaks are currently under investigation at the Omnitrans, the San Bernardino transit agency in the South Coast Air Quality Management District.[38] Odor emanating from methyl mercaptan, and additive to CNG, raised health concerns among neighbors of the CNG facility. The levels of methyl mercaptan released were too small to cause health risks. In response to complaints about odors from the CNG from, State Senator Nell Soto introduced a bill that would require Omnitrans to assess long-term health impacts of residents living in the vicinity of fueling stations.[39]
Point 7: VII. Develop electric trolley coach expansion plan
Although the initial capital investment in the overhead system for electric trolley buses is high, there are future life-cycle savings due to the less costly operation of trolley coaches (reduced maintenance and power expenses) and the longer life expectancy of the trolley coaches. There are also environmental benefits associated with trolley coach operation, especially with respect to pollution and noise reduction.
Muni will develop an electrification plan and timeline for converting up to 6 bus lines and report at least annually to the Transportation Authority regarding progress on planning and implementation.
Muni's analysis determines 2006 as being an aggressive and optimistic timeline for a line to be electrified and in revenue service. The Transportation Authority and the environmental coalition will prioritize identifying funding and participating in building community support for electrification of bus lines.
Muni's Capital Planning and Legislative Affairs Division has drafted a trolley coach expansion plan that is currently undergoing internal review. In November 2001, Muni held meetings with residents on Potrero Hill to discuss electrification of current diesel lines including the 10-Townsend. Future meetings are planned for this topic. The zero-emissions Third Street Light Rail line is scheduled to replace some of the #15 diesel coach line in 2005.
Point 8: VIII. Participate in a fuel cell pilot program
Due to the fact that approximately half of Muni's fleet is electrified, Muni is not currently required to participate in a fuel cell bus pilot program under California Air Resources Board rules for transit agencies, despite having selected the diesel path under CARB rules.
Muni will participate in a fuel cell pilot program, either through the Fuel
Cell Partnership or in cooperation with AC Transit within 24 months pending resolution
of funding questions.
The California Fuel Cell Partnership ("Partnership) and regional transit agencies will provide Muni the opportunity to observe fuel cell technology first-hand. The Partnership, headquartered in Sacramento, is a collaboration of automotive manufacturers, energy companies, fuel cell technology companies, and government agencies working together to demonstrate fuel cell technology. Muni has participated in meetings with the Partnership, most recently in a workshop on April 25, 2002 in Sacramento. Since 2000, the Partnership has demonstrated 16 fuel cell vehicles, completed a one-year demonstration of DaimlerChrysler's Zebus with SunLine Transit Agency, and built and managed a hydrogen fueling station. The Partnership is currently in the process of constructing a methanol fueling station. Muni also expects to receive information from regional fuel cell programs. AC Transit and Golden Gate Transit have created one partnership to test a fuel-cell bus. Samtrans and VTA have created another partnership. The pilot program is expected to begin in 2003, when fuel-cell buses are expected to be delivered.
Point 9: IX. Deploy the cleanest alternative fuel and/or diesel
buses in neighborhoods most afflicted by multiple pollutant sources
In recognition of the significant levels of pollution afflicting several San Francisco neighborhoods, Muni will deploy its cleanest alternative fuel and/or diesel buses fitted with particulate traps in the most seriously polluted neighborhoods. All neighborhoods will eventually benefit from substantially cleaner bus technology.
Muni has deployed new Neoplan buses on regular routes on Potrero Hill, Bayview, and Hunters Point neighborhoods, where multiple sources of pollution exist. In addition, Muni is planning to operate its CNG and hybrid buses in a pilot program that will bring residents of the Bayview to the Civic Center Farmers' Market and SF General Hospital every Wednesday. Phase Two of the Alternative Fuels Pilot Program will also involve regular testing along routes in neighborhoods afflicted by multiple sources of pollution.
Point 10: X. Determine ways that the health needs in the Bayview
Hunters Point communities can be incorporated into future transportation planning
Muni will work in close cooperation with the Department of Public Health, the Department of the Environment, community leaders, and advocates from the Bayview Hunters Point communities to develop a set of health-based criteria to be used by planners and community representatives as an evaluation metric for clean air transit strategies. Muni will also identify desirable transit alternatives not provided by existing services that could meet community health needs and work with community leaders and advocates to advertise and market future improvements to public transportation in this area.
Over the past year, Muni has worked with the office of Supervisor Sophie Maxwell, and City health and environment officials to address the health needs of residents in the Bayview and Hunters Point neighborhoods:
- In the summer 2001, Muni participated in a City department-wide task force
whose mission was to identify ways to better health for residents of the Bayview
and Hunters Point neighborhoods.
- Also in the summer of 2001, Muni held a meeting in the Bayview to solicit
input on service improvements from Muni employees who lived in the Bayview and
Hunters Point neighborhoods. Muni added service to the 15-Third line as
a result of this meeting.
- In March 2002, Muni worked with the San Francisco Bicycle Coalition to provide
bicycle safety outreach in the Bayview.
- In the ongoing "Bayview Connections" program, Muni is working with
the Bayview community, along with the Redevelopment Agency, Department of Public
Works, and Planning Department to improve pedestrian safety and to establish quality-of-life
improvements in the community.
- The Bayview and Hunters Point communities have been engaged in the transportation
planning process by participating in over a hundred Third Street Light Rail community
meetings that Muni has hosted in the community. Outreach continues as the
Third Street Light Rail project progresses.
- On April 20, 2002, Muni brought its CNG and hybrid buses to the "Peoples
Earth Day" celebration at India Basin Park in Bayview Hunters Point.
- On May 15, Muni initiated service on the new #78 line. The "Bayview
Health Special" will depart the Bayview for the Civic Center Farmers' Market
every Wednesday . The bus will leave the Bayview every hour from 10 am to
2 pm. Residents of the Bayview will have the opportunity to shop for organic
fruits and vegetables at the Farmers Market. Residents can also stop along
the way at SF General for medical needs and at Potrero Center, where a grocery
store and a gym are located.
Point 11: XI. Retrofit diesel buses purchased since 1997 with particulate traps and convert to low-sulfur diesel fuel by the end of 2002
Under the diesel fuel path requirements of CARB Transit Bus Emissions Regulations, Muni would normally be required to install particulate traps on its entire diesel fleet by the end of 2007. Under this agreement, Muni will retrofit diesel buses purchased since 1997 with particulate traps and convert to low-sulfur diesel fuel by the end of 2002.
Muni has converted to ultra-low sulfur diesel (ULSD) well in advance but has lacked the necessary funding to begin installing traps. In January 2002 Muni began converting to ULSD at all divisions except Kirkland, Muni's smallest division. This conversion was initiated six months before the CARB deadline of July 1 and almost a year before the SFCTA deadline of December 31, 2002. The tanks at the Kirkland facility will be cleaned and converted to ULSD by the July 1, 2002 deadline.
Muni's Fleet Engineering section is prepared to initiate the $5.6 million PM trap retrofit program, but the project currently lacks $2 million in funding. The following table illustrates Muni's efforts to secure funding for the PM retrofit project:
Applications for PM Retrofit Program
| Source | Amount | Date applied | Status | Notes: |
| MTC: Federal 5307 emergency project | $2.8 million | Aug. 31, 2001 | AWARDED | Requires $560,000 local match |
| Federal: 5309 Earmark | $1.5 million | April 2001 | AWARDED | Requires $300,000 local match. This is part of the $3.9 million awarded for CNG facilities and PM traps. Muni tentatively anticipates allocating approximately $1.5-2 million for PM traps. |
| CARB:NOx and PM Emission Reduction Program | $1.875 million | April 12, 2001 | DENIED | Jack Kitowski of CARB advised Muni staff verbally on May 3, 2002 that Muni's accelerated PM retrofit program would not be funded. |
| SFCTA: TFCA Program Manager Funds FY01 | $350,000- $850,000 | March 7, 2001 | RULED INELIGIBLE | Ineligible. PM traps are not eligible because they don't reduce NOx. Also, CARB hadn't certified the PM traps when Muni applied. Traps have since been approved, but only reduce PM, not NOx. | /tr>
| SFCTA: TFCA Program Manager Funds FY02 | $950,000 | Feb. 26, 2002 | RULED INELIGIBLE |
Ineligible. BAAQMD does not fund diesel-fueled vehicles, and TFCA funds must only go to projects that reduce NOx. Muni submitted suggestions for changing BAAQMD guidelines, but suggestions were not adopted.[40] BAAQMD did provide Muni funding for the Alternative Fuel Pilot Program. |
| BAAQMD: Carl Moyer fund | $1.5 million | March 6, 2002 | AWARDED approx. $514,664 | Funding will be used for 15 exhaust gas recirculation equipment (EGRs) which reduce NOx, in conjunction with 15 PM traps. |
Other Clean Air Programs
Muni has invested time and money into several other clean air programs that are not mandated by the 11-point agreement.
-
Muni rebuilt 79% of its oldest buses in its active
fleet with equipment that will reduce pollution.[41] Muni rebuilds its New Flyer and Orion
buses with a kit that reduces PM to .10 g/bhp-hr. By December 31, 2002, all of the oldest engines in Muni's
active fleet are expected to be equipped with this technology.
-
Muni has installed bicycle racks on all of its
newest buses. In cooperation with
the San Francisco Bicycle Coalition, Muni equipped all of its newest buses with
bicycle racks. By March, 2003,
almost all of Muni's buses (748 out of 828) will have bike racks. The public transit/bicycle partnership
is designed to promote alternative transportation that will reduce pollution in
the Bay Area.
- Muni is initiating a separate pilot program to test equipment that reduces NOx emissions to levels comparable to CNG buses. Muni plans to retrofit 15 of its buses with exhaust gas recirculation (EGR) equipment that can reduce NOx emissions by 50%,to 2.0g/bhp-hr from 4.0 g/bhp-hr. The EGR pilot will also include the installation of 15 PM traps on Muni's diesel buses.
Muni continues to research and seek funding for innovative programs that reduce emissions.
Summary
Muni has been aggressive in pursuing opportunities to reduce pollution. Muni's primary method of reducing pollution is to encourage people to take public transit. Muni is committed to providing safe, reliable public transit service with a fleet that is fifty-three percent pollution-free. Muni's buses contribute less than 7 percent of the total NOx emissions and negligible amounts of the total PM emissions in San Francisco. By contrast, automobiles are the source of fifty percent of NOx emissions and sixty percent of PM emissions in San Francisco.
Although emissions from Muni's transit vehicles are small compared to other sources, Muni has continued to reduce pollution in its fleet. Muni has accomplished this by:
- Replacing 95 of its oldest buses with new clean diesel buses.
- Initiating an alternative fuels pilot program that will inform future procurements and has drafted specifications.
- Requesting money for alternative fuel buses and is continuing to seek funding for fueling and maintenance facilities for alternative fuels.
- Creating a task force to investigate the facilities implications of an investment in alternative fuel technologies.
- Drafting a trolley coach expansion plan that would increase the number of zero-emissions vehicles.
- Researching and observing the fuel cell pilot programs in the Bay Area.
- Sending the cleanest buses to neighborhoods that are afflicted by multiple sources of pollution.
- Initiating a pilot service that will bring residents of the Bayview to healthy destinations.
- Converting to a cleaner-burning fuel, months in advance of legal deadlines.
- Seeking funding to reduce particulate emissions further.
- Installing pollution-reducing kits on most of its oldest buses.
- Installing bicycle racks on all of its newest buses.
- Initiating another pilot program to test equipment that reduces NOx emissions by fifty percent.
Muni's commitment is to provide safe, reliable transportation and at the same
time to reduce pollution and find new ways to promote a clean environment.
Appendix A
Muni Bus Purchase Proposal
Developed in cooperation with Municipal Transportation Agency
and Department of Environment staff
Background
Muni operates a fleet of 455 diesel motor coaches. Many vehicles are operating beyond their approved 12 year life span, resulting in breakdowns and delays in service to passengers. There is consensus that Muni's older vehicles are highly polluting models that should be removed from service as quickly as possible.
In 1997, Muni received approval from the San Francisco County Transportation Authority to replace approximately half of its fleet (235 vehicles, including 135 40' motor coaches and 100 60' articulated coaches) with diesel buses. The proposed contract with Neoplan also included a future potential option to purchase 175 vehicles.
Environmental groups including the Union of Concerned Scientists, the Natural Resources Defense Council and the SF League of Conservation Voters initially opposed the purchase of diesel buses. At the time, Supervisor Ammiano sponsored negotiations with Muni and the environmental coalition which culminated in an agreement by Muni to acquire and test 2 CNG and 2 hybrid-electric motor coaches for an alternative fuel pilot program and for Muni to develop a plan for potential electrification of diesel routes. The Transportation Authority approved the proposed bus purchase but provided direction to implement the alternative fuel pilot program. Due to several factors, Muni's pilot program had not commenced road tests as of the beginning of 2001.
On the heals of a contentious decision to adopt the diesel fuel path in response to the CARB Transit Bus Emissions Regulations in late 2000, Muni prepared to approach the Transportation Authority in January of 2001 for approval to exercise its Neoplan option to replace 175 vehicles. The environmental coalition that opposed Muni's diesel fuel path choice, which included the Union of Concerned Scientists, the American Lung Association, Our Children's Earth, the Planning and Conservation League and Bayview Hunters Point Community Advocates, geared up to oppose approval of new diesel buses.
Negotiations
Supervisor Ammiano requested that Muni negotiate a one month deferral of the option with Neoplan so that the various sides could discuss a potential compromise. Discussions occurred over approximately a three week period and included representatives of each of the environmental organizations, Rescue Muni (supporting Muni's position) and city staff from Muni, the Department of the Environment, the City Attorney's Office and the Department of Public Health.
The discussions revealed underlying differences of opinion as to whether purchasing natural gas technology would pose a risk to the reliability of Muni service and the extent to which purchasing diesel versus alternative fuel bus technology would reduce air pollution in the City.
The following proposed bus purchase is the product of these negotiations and has the support of Supervisor Ammiano, Muni and Rescue Muni. Parts of the plan are also supported by staff of the Department of the Environment. While praising the progress made during the negotiations, the environmental coalition does not support the final proposal due to objections about the number of diesel buses contemplated and the failure to commit immediately to CNG technology.
Proposed Muni Bus Purchase Plan
This proposal assumes release of local match dollars sufficient to purchase a total of 95 diesel motor coaches equipped with particulate trap emission controls. Assuming successful completion of prototype testing of CNG and diesel-electric hybrid buses scheduled to begin this month, Muni will purchase either CNG or diesel-electric hybrid buses for the remainder of Muni's motor coach replacement plan, which will require at least 105 additional vehicles.
The proposal also includes:
a schedule for installing pollution controls on the remainder of Muni's diesel fleet that is more aggressive than that required by state regulations;
retrofit of Muni facilities to handle lighter-than-air fuels pending identification of funding;
development of an electric trolley coach expansion plan for up to 6 bus lines;
commencement of testing and/or in-service use of a variety of alternative fuel bus technologies within 24 months, including fuel cell buses;
deployment of Muni's cleanest vehicles in the City's most polluted neighborhoods; and
interdepartmental planning to incorporate health needs of the Bayview Hunters Point communities in future transportation planning.
The plan is designed to ensure that Muni will, as an organization, become experienced at adapting to and operating the newest and least polluting bus technologies available in the future. The plan is also designed to pose the least risk to Muni's ability to meet the service standards required by Proposition E. Major elements of the plan are subject to future approval by the Municipal Transportation Agency Board, the San Francisco County Transportation Authority and the San Francisco Board of Supervisors.
I. Approve purchase of 95 diesel buses; defer purchase of 80 buses
The older 60-foot articulated buses in Muni's fleet are on average over 18 years old, six years past their useful life, as defined by FTA standards.
Muni will purchase 24 60' articulated buses and an additional 71 standard 40' diesel coaches under this plan. Muni will defer the purchase of the remaining 80 diesel buses pending the outcome of prototype testing of compressed natural gas (CNG) and diesel hybrid-electric motor coaches.
II. Commence prototype testing of 2 CNG and 2 hybrid-electric buses to inform the purchase of 80 40-foot coaches
Starting March, 2001, Muni will commence prototype testing of 2 CNG and 2 diesel-electric hybrid buses, with independent oversight by the Department of the Environment, an independent consultant and a peer review panel with representatives from transit agencies that successfully operate CNG buses. The prototype program will last for 8 months prior to issuance of the resulting RFP for the purchase of 40-foot coaches (3/01-10/01); prototype testing will continue for an additional 18 months thereafter.
III. Commence specification and procurement by developing an RFP for 80 CNG or diesel-electric hybrid buses
Concurrent with the prototype testing, Muni will begin developing specifications and an RFP for 80 CNG or diesel-electric hybrid 40-foot coaches.
If prototype testing is successful, CNG or diesel-electric hybrid buses will be operated along the following proposed routes which Muni has determined offer the best topography and service levels for these technologies: lines 2, 16AX/BX, 17, 23, 28, 47, 80X, 81X, 82X, 88, 89.
Muni's research has found that agencies with lower ridership and lighter duty cycles are generally more successful with CNG technology. Agencies with high ridership and heavy urban duty cycles have been less successful; these agencies consistently cite higher-than-anticipated operating and maintenance costs for CNG technology.
This research supports Muni's assertion that a comprehensive testing of CNG and diesel-electric hybrid technology in the San Francisco operating environment is essential prior to making a commitment to invest in CNG or diesel-electric vehicles and infrastructure.
IV. Acquire a minimum of 15 CNG 40-foot coaches for revenue service, subject to satisfactory completion of prototype testing and acquisition of fueling infrastructure
To gain revenue service experience with lighter than air alternative fuels, Muni will purchase a minimum of 15 CNG 40-foot coaches for in-service use, subject to satisfactory completion of prototype testing and acquisition of fueling infrastructure. Installation of fueling infrastructure must be free, with guarantees of CNG fuel at or below the cost of diesel or the Transportation Authority must identify funding for fueling infrastructure.
If prototype testing of CNG and diesel-electric hybrid coaches indicates the same reliability and the minimum conditions described above are met, Muni will favor the purchase of CNG buses for the remaining 65 40' coaches; otherwise Muni will seek Transportation Authority and Board of Supervisors approval to purchase 65 40' diesel-electric hybrid buses. Muni will only approach the Transportation Authority seeking approval of the option to purchase 80 diesel coaches in the event that prototype testing fails.
V. Purchase CNG or diesel-electric hybrid coaches to replace 30' Orion motor coaches, contingent on successful prototype testing
Muni is in the early stages of planning to replace 25 30' Orion coaches. Subject to successful prototype testing, Muni will purchase either CNG or diesel-electric hybrid buses to replace these coaches.
VI. Accommodate maintenance of vehicles fueled by lighter than air fuel through the redesign of Islais Creek maintenance facility and part of the Woods maintenance facility
Subject to availability of funds, Muni will re-engineer the final design of the proposed Islais Creek maintenance facility and retrofit part of the existing Woods maintenance facility to accommodate fueling and related infrastructure required to operate motor coaches fueled by lighter than air fuels (e.g., natural gas, hydrogen, etc.).
It is expected that the next significant change in transit bus technology will be toward hydrogen-based fuel cells and that this change could occur within a decade. Since the Islais Creek maintenance facility is projected to serve Muni for 30 to 50 years, re-engineering of the final facility design to accommodate lighter than air fuels is considered cost-effective.
Muni is in the process of applying for funds for preliminary facility engineering and design for incorporation of CNG technology. These federal and state funds, whose funding cycles begin annually in March, can be used either for conversion of an existing facility or redesign of Muni's future facility, Islais Creek.
VII. Develop electric trolley coach expansion plan
Although the initial capital investment in the overhead system for electric trolley buses is high, there are future life-cycle savings due to the less costly operation of trolley coaches (reduced maintenance and power expenses) and the longer life expectancy of the trolley coaches. There are also environmental benefits associated with trolley coach operation, especially with respect to pollution and noise reduction.
Muni will develop an electrification plan and timeline for converting up to 6 bus lines and report at least annually to the Transportation Authority regarding progress on planning and implementation.
Muni's analysis determines 2006 as being an aggressive and optimistic timeline for a line to be electrified and in revenue service. The Transportation Authority and the environmental coalition will prioritize identifying funding and participating in building community support for electrification of bus lines.
VIII. Participate in a fuel cell pilot program
Due to the fact that approximately half of Muni's fleet is electrified, Muni is not currently required to participate in a fuel cell bus pilot program under California Air Resources Board rules for transit agencies, despite having selected the diesel path under CARB rules.
Muni will participate in a fuel cell pilot program, either through the Fuel Cell Partnership or in cooperation with AC Transit within 24 months pending resolution of funding questions.
IX. Deploy the cleanest alternative fuel and/or diesel buses in neighborhoods most afflicted by multiple pollutant sources
In recognition of the significant levels of pollution afflicting several San Francisco neighborhoods, Muni will deploy its cleanest alternative fuel and/or diesel buses fitted with particulate traps in the most seriously polluted neighborhoods. All neighborhoods will eventually benefit from substantially cleaner bus technology.
X. Determine ways that the health needs in the Bayview Hunters Point communities can be incorporated into future transportation planning
Muni will work in close cooperation with the Department of Public Health, the Department of the Environment, community leaders, and advocates from the Bayview Hunters Point communities to develop a set of health-based criteria to be used by planners and community representatives as an evaluation metric for clean air transit strategies. Muni will also identify desirable transit alternatives not provided by existing services that could meet community health needs and work with community leaders and advocates to advertise and market future improvements to public transportation in this area.
XI. Retrofit diesel buses purchased since 1997 with particulate traps and convert to low-sulfur diesel fuel by the end of 2002
Under the diesel fuel path requirements of CARB Transit Bus Emissions Regulations,
Muni would normally be required to install particulate traps on its entire diesel
fleet by the end of 2007. Under this agreement, Muni will retrofit diesel buses
purchased since 1997 with particulate traps and convert to low-sulfur diesel fuel
by the end of 2002.
Appendix B
An Acrobat PDF (400kb) version of Appendix B will allow you to view slides more easily.
PowerPoint Presentation
UC Davis-ITS Preliminary Chassis Dynamometer Test Results for Four Types of Advanced Technology Buses
Slide 1
Slide 2
Slide 3
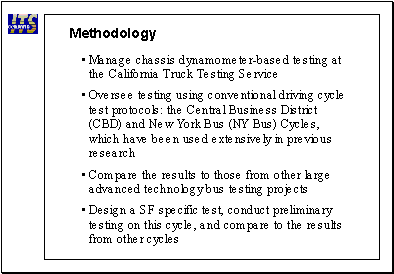
Driving cycles are speed-time traces that represent vehicle operation.
Differences in facilities and vehicle design (i.e., vehicle weight, engine size, and programming) result in variation between our findings and others, however, results from other alternative vehicle projects are presented to confirm that the results are reasonable
Slide 4
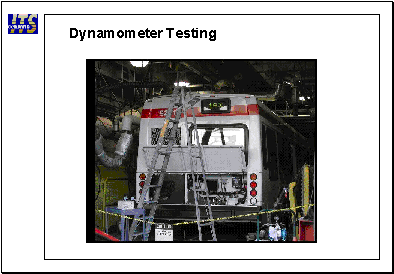
Slide 5
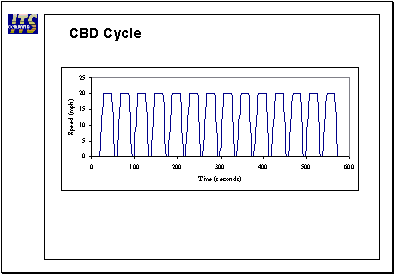
The CBD is a geometric cycle that consists of 14 identical peaks (Figure 2). Each peak is an acceleration to 20mph, a cruise, and then a deceleration to idle. The cycle is approximately 2 miles long, takes 600 seconds to complete, and has an average speed of 12.6 mph. The severe decelerations are not typical of the Muni operations we observed thus far. The CBD Cycle may not reflect real-world hybrid bus performance because regenerative braking that may occur in reality (i.e. during slower decelerations) does not take place during the CBD Cycle's steep decelerations.
Slide 6
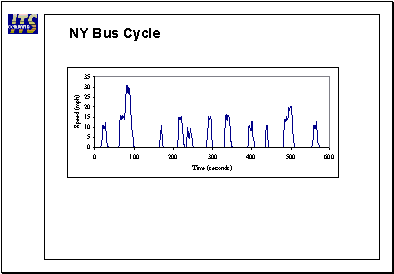
Closer but still not SF.
The New York Bus Cycle (NY Bus) was developed from speed-time data collected from heavy-duty vehicles (both trucks and transit buses) in New York City, but the cycle was statistically generated using Monte Carlo simulation. This cycle (Figure 2) is 571 seconds in length, covers a distance of approximately 0.6 miles, and has an average speed of 3.7 mph. Although this average speed is lower than we observed for San Francisco, the NY Bus Cycle does offer a variety of acceleration and deceleration rates more typical of in-use operation. These rates are less severe than those in the CBD, which allows the regenerative braking system of hybrid vehicles to capture vehicle inertial energy.
Slide 7
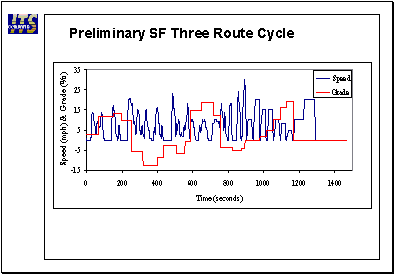
San Francisco has unique terrain and operating characteristics that are not reflected in either the NY Bus or CBD Cycles. Driving cycles were created specifically for San Francisco by collecting vehicle characteristics (e.g. vehicle speed, engine speed, and power) from the alternative fueled buses operating on three Muni routes. The data were obtained by logging engine data bus signals via the communications ports in the buses. Data were collected on three routes at non-peak times on weekdays. Traffic counts were used to verify that the traffic conditions were similar for each data collection. Three sections of the route data were selected which represented diverse Muni bus operations. One route section was relatively flat with high pedestrian concentrations and frequent stops and starts. The second section had long, steep upgrades with few stops. The third route section was dominated by moderate downgrades and had few stops.
Slide 8
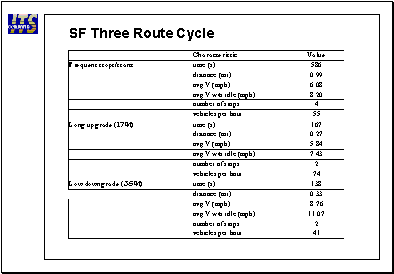
Slide 9
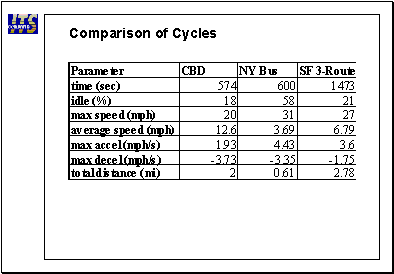
Slide 10
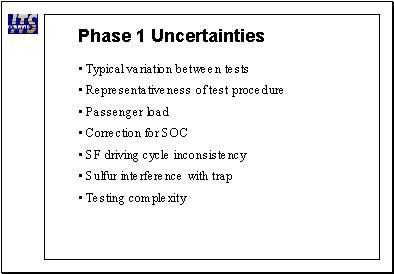
For example, show testing complexity
Slide 11
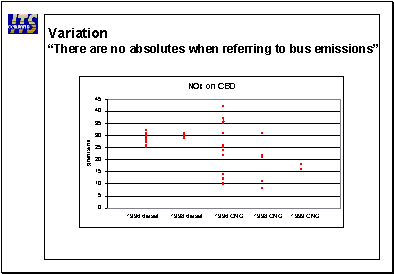
All averages for replications on tests. So each point varies by factor of 4.
Slide 12
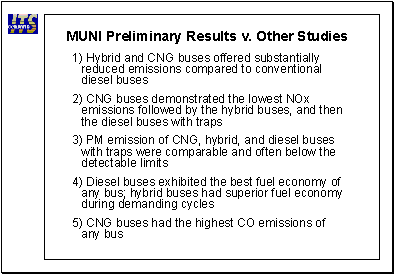
Slide 13
Slide 14
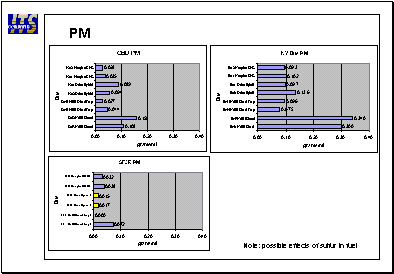
Slide 15
Slide 16
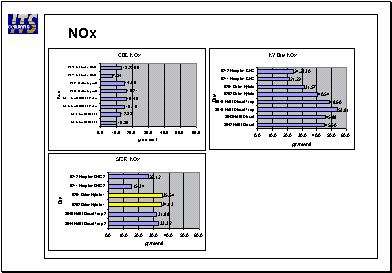
Two tests not enough. Need bigger average.
Slide 17
Complicated test series for CATTS.
Slide 18
Fuel economy was compared on the basis of diesel fuel consumption in units of miles per gallon.
In order to compare the fuel economy of the CNG bus, CNG fuel consumption was converted to diesel gallons equivalent using a conversion factor of 137 cubic feet of natural gas per gallon of diesel fuel.
Fuel economy from the diesel bus and the diesel bus with trap were expected to be similar since properly operating traps do not affect fuel economy. The results of the SF 3- Route Cycle are consistent with this. However, the buses with traps were more than 20% less efficient on the NY Bus Cycle. This decrease in fuel economy may be attributed to sulfur in the fuel interfering with the traps and creating a backpressure. Muni is in the process of switching to a low sulfur fuel which will enable optimal performance of the particulate traps. Currently, Muni does use CARB 2 diesel fuel which has a sulfur level of 120 ppm or less. That fuel was run through the buses when they were tested, but the residual sulfur was in the trap. It is possible that the levels of sulfur in the trap differed between the tests on the buses with the diesel than on the diesel with trap.
Slide 19
Fuel economy was compared on the basis of diesel fuel consumption in units of miles per gallon.
In order to compare the fuel economy of the CNG bus, CNG fuel consumption was converted to diesel gallons equivalent using a conversion factor of 137 cubic feet of natural gas per gallon of diesel fuel.
Fuel economy from the diesel bus and the diesel bus with trap were expected to be similar since properly operating traps do not affect fuel economy. The results of the SF 3- Route Cycle are consistent with this. However, the buses with traps were more than 20% less efficient on the NY Bus Cycle. This decrease in fuel economy may be attributed to sulfur in the fuel interfering with the traps and creating a backpressure. Muni is in the process of switching to a low sulfur fuel which will enable optimal performance of the particulate traps. Currently, Muni does use CARB 2 diesel fuel which has a sulfur level of 120 PPM or less. That fuel was run through the buses when they were tested, but the residual sulfur was in the trap. It is possible that the levels of sulfur in the trap differed between the tests on the buses with the diesel than on the diesel with trap.
Slide 20
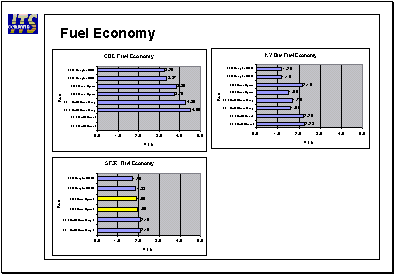
Slide 21
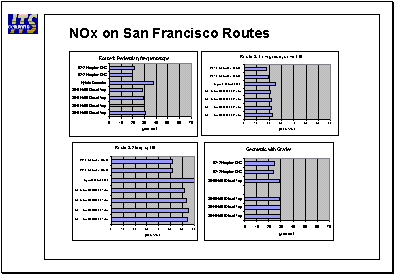
Slide 22
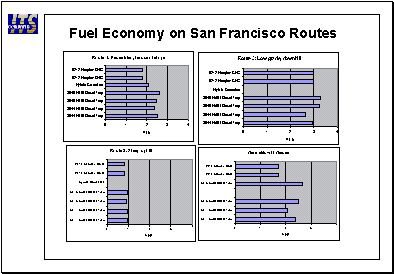
Slide 23
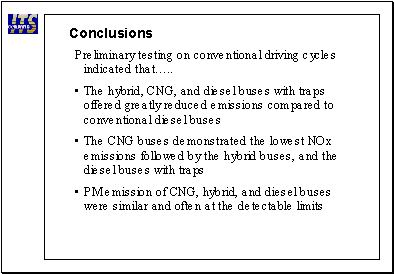
Fuel economy from the diesel bus and the diesel bus with trap were expected to be similar since properly operating traps do not affect fuel economy. The results of the SF 3- Route Cycle are consistent with this. However, the buses with traps were more than 20% less efficient on the NY Bus Cycle. This decrease in fuel economy may be attributed to sulfur in the fuel interfering with the traps and creating a backpressure. Muni is in the process of switching to a low sulfur fuel which will enable optimal performance of the particulate traps. Currently, Muni does use CARB 2 diesel fuel which has a sulfur level of 120 PPM or less. That fuel was run through the buses when they were tested, but the residual sulfur was in the trap. It is possible that the levels of sulfur in the trap differed between the tests on the buses with the diesel than on the diesel with trap.
Slide 24
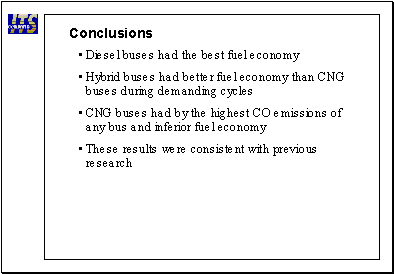
Fuel economy from the diesel bus and the diesel bus with trap were expected to be similar since properly operating traps do not affect fuel economy. The results of the SF 3- Route Cycle are consistent with this. However, the buses with traps were more than 20% less efficient on the NY Bus Cycle. This decrease in fuel economy may be attributed to sulfur in the fuel interfering with the traps and creating a backpressure. Muni is in the process of switching to a low sulfur fuel which will enable optimal performance of the particulate traps. Currently, Muni does use CARB 2 diesel fuel which has a sulfur level of 120 PPM or less. That fuel was run through the buses when they were tested, but the residual sulfur was in the trap. It is possible that the levels of sulfur in the trap differed between the tests on the buses with the diesel than on the diesel with trap.
Slide 25
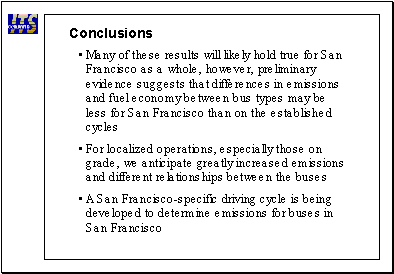
Fuel economy from the diesel bus and the diesel bus with trap were expected to be similar since properly operating traps do not affect fuel economy. The results of the SF 3- Route Cycle are consistent with this. However, the buses with traps were more than 20% less efficient on the NY Bus Cycle. This decrease in fuel economy may be attributed to sulfur in the fuel interfering with the traps and creating a backpressure. Muni is in the process of switching to a low sulfur fuel which will enable optimal performance of the particulate traps. Currently, Muni does use CARB 2 diesel fuel which has a sulfur level of 120 PPM or less. That fuel was run through the buses when they were tested, but the residual sulfur was in the trap. It is possible that the levels of sulfur in the trap differed between the tests on the buses with the diesel than on the diesel with trap.
Slide 26
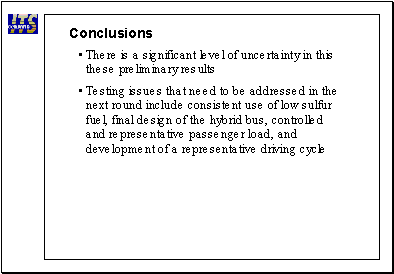
Fuel economy from the diesel bus and the diesel bus with trap were expected
to be similar since properly operating traps do not affect fuel economy.
The results of the SF 3- Route Cycle are consistent with this. However,
the buses with traps were more than 20% less efficient on the NY Bus Cycle.
This decrease in fuel economy may be attributed to sulfur in the fuel interfering
with the traps and creating a backpressure. Muni is in the process of switching
to a low sulfur fuel which will enable optimal performance of the particulate
traps. Currently, Muni does use CARB 2 diesel fuel which has a sulfur level
of 120 PPM or less. That fuel was run through the buses when they were tested,
but the residual sulfur was in the trap. It is possible that the levels of sulfur
in the trap differed between the tests on the buses with the diesel than on the
diesel with trap.
Appendix C
Fiscal Impacts on Variable Operating Costs, Given Different Running Times
| What are the fiscal impacts of service that increases running time? | 10% Increase in Running Time | 05% Increase in Running Time | Current Operations and Cost | 06% Decrease in Running Time | Operating Cost Variation between 5% Slower Running Time and 6% Faster Running Time |
|---|---|---|---|---|---|
| Scenario 1 - Point III ("Flat" Line Assignment - 60 Coaches on Motorcoach Lines 2,47,17,23,28,88) | $ 23,758,729 | $ 22,678,787 | $ 21,605,945 | $ 20,302,914 | $ 2,375,873 |
| Scenario 2 - Point IX (Environmental Justice Line Assignment - 60 Coaches on Motorcoach Lines 23,19,29,44,48) | $ 28,091,215 | $ 26,814,342 | $ 25,545,863 | $ 24,005,220 | $ 2,809,122 |
Summary Graph
The following graph extracts and illustrates the results of this analysis from the "Operating Cost" Worksheet which follows it.
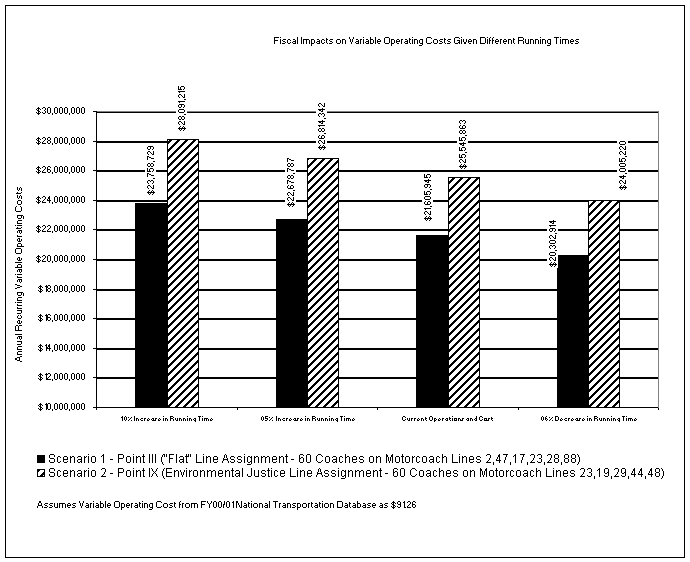
Operating Cost Worksheet
The Operating Cost Worksheet below shows each 30' and 40' motor coach line, and its revenue hours.
Column A is the line number. In some cases the data groups similar lines together. So the Richmond Expresses (1AX, 1BX, 31AX, 31BX, 38AX, 38BX) are all lumped together under 1X. The 9AX and 9BX are lumped under 9X (this does not include the actual 9X line, which operates as an artic line). The 16AX and 16BX are shown as 16X. The 80X and 81X are lumped together. The 28 and 28L are shown as the 28; and the 71 and 71L are shown as the 71.
Columns B, C, and D were added to aid in scenario line aggregations.
Column E is the peak demand for vehicles. In some cases this is the AM and in some the PM peak. Peak with the highest demand was used (most are PM peak except for the expresses, which tend to be higher in the AM). These numbers are from March 2001, and may differ slightly today.
Columns F and G refer to current running times. Column F shows the revenue hours per year for each line. These are estimates based on the sign-ups for 6/01, 8/01, 1/02, and 3/02. It assumes the 3/02 revenue hours continue until 6/30/02. Revenue hours include layover time, but not deadhead time. Column G takes the annual revenue hours and multiplies them by $91.26, which is the motor coach variable cost per hour stated in the National Transit Database.
Columns H, I, and J add 20% to running time. Column H is the revised annual revenue hours, column I multiplies those hours by $91.26, and column J shows the cost difference between the current running time and the 20% increase.
Columns K, L, and M add 10% to running time. Column descriptions are the same as above.
Columns N, O, and P add 5% to running time. Column descriptions are the same as above.
Columns Q, R, and S subtract 6% from running time. Column descriptions are the same as above.
Column T shows the annual cost difference between adding 5% running time (CNG) and subtracting 6% running time (hybrid).
IMPACTS ON VARIABLE OPERATING COSTS GIVEN DIFFERENT RUNNING TIMESAssumes Variable Operating Cost from FY00/01 NTD as $91.26.
| Line | Point III | Point IX | Existing Data | Peak Demand for Vehicles | Current Running Time: Rev hrs/yr | Var Cost/Year | Rev hrs/yr | Add 10% Running Time: Var Cost/Year | Diff/Year | Rev hrs/yr | Add 5% Running Time: Var Cost/Year | Diff/Year | Rev hrs/yr | Reduce 6% Running Time: Var Cost/Year | Diff/Year | Diff btw adding 5% & reducing by 6% |
| 54 | 2 | 6 | 40,308 | $3,679,717 | 44,339 | $4,046,359 | $366,642 | 42,323 | $3,862,433 | $182,716 | 37,890 | $3,457,798 | -$221,920 | -$404,636 | ||
| 19 | 2 | 3 | 15 | 78,481 | $7,164,530 | 86,329 | $7,878,394 | $713,863 | 82,405 | $7,520,285 | $355,754 | 73,772 | $6,732,445 | -$432,085 | -$787,839 | |
| 56 | 2 | 1 | 5,829 | $532,129 | 6,412 | $585,150 | $53,021 | 6,120 | $558,552 | $26,423 | 5,479 | $500,037 | -$32,092 | -$58,515 | ||
| 2 | 1 | 11 | 35,641 | $3,253,642 | 39,205 | $3,577,830 | $324,188 | 37,423 | $3,415,202 | $161,559 | 33,502 | $3,057,419 | -$196,224 | -$357,783 | ||
| 16X | 19 | 10,857 | $991,136 | 11,943 | $1,089,891 | $98,755 | 11,400 | $1,040,350 | $49,215 | 10,206 | $931,361 | -$59,774 | -$108,989 | |||
| 28 | 1 | 3 | 22 | 69,013 | $6,300,197 | 75,914 | $6,927,939 | $627,742 | 72,464 | $6,613,033 | $312,836 | 64,872 | $5,920,239 | -$379,958 | -$692,794 | |
| 23 | 1 | 2 | 7 | 28,489 | $2,600,761 | 31,338 | $2,859,897 | $259,136 | 29,913 | $2,729,901 | $129,141 | 26,780 | $2,443,912 | -$156,849 | -$285,990 | |
| 17 | 1 | 3 | 17,906 | $1,634,639 | 19,697 | $1,797,512 | $162,873 | 18,801 | $1,715,807 | $81,168 | 16,832 | $1,536,055 | -$98,583 | -$179,751 | ||
| 88 | 1 | 2 | 4,768 | $435,271 | 5,245 | $478,640 | $43,370 | 5,006 | $456,884 | $21,613 | 4,482 | $409,020 | -$26,251 | -$47,864 | ||
| 29 | 2 | 14 | 72,226 | $6,593,512 | 79,449 | $7,250,479 | $656,968 | 75,837 | $6,920,912 | $327,400 | 67,892 | $6,195,864 | -$397,647 | -$725,048 | ||
| 1X | 34 | 16,047 | $1,464,911 | 17,651 | $1,610,872 | $145,962 | 16,849 | $1,537,651 | $72,740 | 15,084 | $1,376,563 | -$88,347 | -$161,087 | |||
| 9X | 9 | 19,444 | $1,775,043 | 21,388 | $1,951,905 | $176,863 | 20,416 | $1,863,182 | $88,140 | 18,277 | $1,667,992 | -$107,051 | -$195,191 | |||
| 44 | 2 | 13 | 53,950 | $4,925,096 | 59,345 | $5,415,825 | $490,729 | 56,648 | $5,169,651 | $244,555 | 50,713 | $4,628,068 | -$297,027 | -$541,582 | ||
| 10 | 50,042 | $4,568,334 | 55,046 | $5,023,516 | $455,182 | 52,544 | $4,795,175 | $226,840 | 47,039 | $4,292,823 | -$275,511 | -$502,352 | ||||
| 12 | 13 | 66,287 | $6,051,340 | 72,916 | $6,654,287 | $602,947 | 69,601 | $6,351,819 | $300,479 | 62,310 | $5,686,391 | -$364,950 | -$665,429 | |||
| 18 | 6 | 25,752 | $2,350,900 | 28,327 | $2,585,140 | $234,240 | 27,040 | $2,467,634 | $116,734 | 24,207 | $2,209,120 | -$141,780 | -$258,514 | |||
| 26 | 7 | 39,598 | $3,614,901 | 43,558 | $3,975,085 | $360,183 | 41,578 | $3,794,399 | $179,498 | 37,222 | $3,396,891 | -$218,011 | -$397,508 | |||
| 27 | 46,191 | $4,216,776 | 50,810 | $4,636,930 | $420,153 | 48,501 | $4,426,160 | $209,384 | 43,420 | $3,962,467 | -$254,309 | -$463,693 | ||||
| 30X | 12 | 5,258 | $480,003 | 5,784 | $527,830 | $47,827 | 5,521 | $503,837 | $23,835 | 4,943 | $451,054 | -$28,948 | -$52,783 | |||
| 35 | 2 | 8,209 | $749,400 | 9,030 | $824,069 | $74,669 | 8,619 | $786,611 | $37,211 | 7,716 | $704,204 | -$45,195 | -$82,407 | |||
| 36 | 5 | 17,384 | $1,586,985 | 19,122 | $1,745,110 | $158,125 | 18,253 | $1,665,787 | $78,802 | 16,341 | $1,491,276 | -$95,709 | -$174,511 | |||
| 37 | 4 | 23,234 | $2,121,032 | 25,557 | $2,332,368 | $211,336 | 24,396 | $2,226,352 | $105,320 | 21,840 | $1,993,115 | -$127,917 | -$233,237 | |||
| 39 | 2 | 8,600 | $785,094 | 9,460 | $863,320 | $78,226 | 9,030 | $824,078 | $38,984 | 8,084 | $737,746 | -$47,348 | -$86,332 | |||
| 43 | 16 | 51,633 | $4,713,577 | 56,796 | $5,183,230 | $469,654 | 54,215 | $4,947,629 | $234,052 | 48,535 | $4,429,306 | -$284,271 | -$518,323 | |||
| 47 | 1 | 15 | 80,857 | $7,381,436 | 88,943 | $8,116,911 | $735,475 | 84,900 | $7,747,960 | $366,525 | 76,006 | $6,936,269 | -$445,166 | -$811,691 | ||
| 52 | 4 | 22,555 | $2,059,046 | 24,811 | $2,264,206 | $205,160 | 23,683 | $2,161,288 | $102,242 | 21,202 | $1,934,867 | -$124,179 | -$226,421 | |||
| 53 | 2 | 12,829 | $1,171,159 | 14,112 | $1,287,852 | $116,693 | 13,470 | $1,229,313 | $58,154 | 12,059 | $1,100,528 | -$70,631 | -$128,785 | |||
| 66 | 5 | 15,003 | $1,369,624 | 16,503 | $1,506,091 | $136,467 | 15,753 | $1,437,632 | $68,009 | 14,103 | $1,287,023 | -$82,601 | -$150,609 | |||
| 67 | 4 | 24,250 | $2,213,783 | 26,675 | $2,434,361 | $220,578 | 25,463 | $2,323,708 | $109,925 | 22,795 | $2,080,272 | -$133,511 | -$243,436 | |||
| 71 | 13 | 59,984 | $5,475,939 | 65,982 | $6,021,554 | $545,614 | 62,983 | $5,747,847 | $271,907 | 56,385 | $5,145,691 | -$330,248 | -$602,155 | |||
| 76 | 1,483 | $135,383 | 1,631 | $148,872 | $13,489 | 1,557 | $142,106 | $6,722 | 1,394 | $127,218 | -$8,165 | -$14,887 | ||||
| 80/81 | 9 | 6,069 | $554,039 | 6,676 | $609,243 | $55,204 | 6,372 | $581,550 | $27,511 | 5,705 | $520,626 | -$33,413 | -$60,924 | |||
| 82X | 5 | 961 | $87,730 | 1,057 | $96,471 | $8,741 | 1,009 | $92,086 | $4,356 | 903 | $82,439 | -$5,291 | -$9,647 | |||
| 48 | 2 | 11 | 46,686 | $4,261,965 | 51,355 | $4,686,621 | $424,656 | 49,020 | $4,473,593 | $211,628 | 43,885 | $4,004,930 | -$257,034 | -$468,662 | ||
| 89 | 1 | 4,135 | $377,484 | 4,549 | $415,096 | $37,612 | 4,342 | $396,228 | $18,744 | 3,887 | $354,718 | -$22,766 | -$41,510 | |||
| 90 | 9,181 | $838,133 | 10,099 | $921,644 | $83,510 | 9,640 | $879,751 | $41,617 | 8,630 | $787,587 | -$50,547 | -$92,164 | ||||
| 91 | 19,252 | $1,757,515 | 21,177 | $1,932,631 | $175,116 | 20,215 | $1,844,784 | $87,269 | 18,097 | $1,651,521 | -$105,994 | -$193,263 | ||||
| Total | 292 | 1,098,392 | $100,272,161 | 1,208,231 | $110,263,130 | $9,990,969 | 1,153,311 | $105,251,170 | $4,979,009 | 1,032,488 | $94,224,857 | -$6,047,304 | -$11,026,313 |
Scenario 1 - Point III ("Flat" Line Assignment - 60 Coaches on Motorcoach Lines 2, 47, 17, 23, 28, 88)
| Line | Point III | Point IX | Existing Data | Peak Demand for Vehicles |
Current Running Time: Rev hrs/yr | Var Cost/Year | Rev hrs/yr | Add 10% Running Time: Var Cost/Year | Diff/Year | Rev hrs/yr | Add 5% Running Time: Var Cost/Year | Diff/Year | Rev hrs/yr | Reduce 6% Running Time: Var Cost/Year | Diff/Year | Diff btw adding 5% and reducing by 6% |
| 2 | 1 | 11 | 35,641 | $3,253,642 | 39,205 | $3,577,830 | $324,188 | 37,423 | $3,415,202 | $161,559 | 33,502 | $3,057,419 | -$196,224 | -$357,783 | ||
| 47 | 1 | 15 | 80,857 | $7,381,436 | 88,943 | $8,116,911 | $735,475 | 84,900 | $7,747,960 | $366,525 | 76,006 | $6,936,269 | -$445,166 | -$811,691 | ||
| 17 | 1 | 3 | 17,906 | $1,634,639 | 19,697 | $1,797,512 | $162,873 | 18,801 | $1,715,807 | $81,168 | 16,832 | $1,536,055 | -$98,583 | -$179,751 | ||
| 23 | 1 | 2 | 7 | 28,489 | $2,600,761 | 31,338 | $2,859,897 | $259,136 | 29,913 | $2,729,901 | $129,141 | 26,780 | $2,443,912 | -$156,849 | -$285,990 | |
| 28 | 1 | 3 | 22 | 69,013 | $6,300,197 | 75,914 | $6,927,939 | $627,742 | 72,464 | $6,613,033 | $312,836 | 64,872 | $5,920,239 | -$379,958 | -$692,794 | |
| 88 | 1 | 2 | 4,768 | $435,271 | 5,245 | $478,640 | $43,370 | 5,006 | $456,884 | $21,613 | 4,482 | $409,020 | -$26,251 | -$47,864 | ||
| Total | 60 | 236,674 | $21,605,945 | 260,341 | $23,758,729 | $2,152,784 | 248,507 | $22,678,787 | $1,072,842 | 222,473 | $20,302,914 | -$1,303,031 | -$2,375,873 |
Scenario 2 - Point IX (Environmental Justice Line Assignment - 60 Coaches on Motorcoach Lines 23, 19, 29 ,44, 48)
| Line | Point III | Point IX | Existing Data | Peak Demand for Vehicles | Current Running Time: Rev hrs/yr | Var Cost/Year | Rev hrs/yr | Add 10% Running Time: Var Cost/Year | Diff/Year | Rev hrs/yr | Add 5% Running Time: Var Cost/Year | Diff/Year | Rev hrs/yr | Reduce 6% Running Time: Var Cost/Year | Diff/Year | Diff btw adding 5% and reducing by 6% |
| 23 | 1 | 2 | 7 | 28,489 | $2,600,761 | 31,338 | $2,859,897 | $259,136 | 29,913 | $2,729,901 | $129,141 | 26,780 | $2,443,912 | -$156,849 | -$285,990 | |
| 19 | 2 | 3 | 15 | 78,481 | $7,164,530 | 86,329 | $7,878,394 | $713,863 | 82,405 | $7,520,285 | $355,754 | 73,772 | $6,732,445 | -$432,085 | -$787,839 | |
| 29 | 2 | 14 | 72,226 | $6,593,512 | 79,449 | $7,250,479 | $656,968 | 75,837 | $6,920,912 | $327,400 | 67,892 | $6,195,864 | -$397,647 | -$725,048 | ||
| 44 | 2 | 13 | 53,950 | $4,925,096 | 59,345 | $5,415,825 | $490,729 | 56,648 | $5,169,651 | $244,555 | 50,713 | $4,628,068 | -$297,027 | -$541,582 | ||
| 48 | 2 | 11 | 46,686 | $4,261,965 | 51,355 | $4,686,621 | $424,656 | 49,020 | $4,473,593 | $211,628 | 43,885 | $4,004,930 | -$257,034 | -$468,662 | ||
| Total | 60 | 279,832 | $25,545,863 | 307,815 | $28,091,215 | $2,545,352 | 293,824 | $26,814,342 | $1,268,478 | 263,042 | $24,005,220 | -$1,540,643 | -$2,809,122 |
Scenario 3- Actual data - 37 Coaches on Analyzed Lines 19 and 28
| Line | Point III | Point IX | Existing Data | Peak Demand for Vehicles | Current Running Time: Rev hrs/yr | Var Cost/Year | Rev hrs/yr | Add 10% Running Time: Var Cost/Year | Diff/Year | Rev hrs/yr | Add 5% Running Time: Var Cost/Year | Diff/Year | Rev hrs/yr | Reduce 6% Running Time: Var Cost/Year | Diff/Year | Diff btw adding 5% and reducing by 6% |
| 19 | 2 | 3 | 15 | 78,481 | $7,164,530 | 86,329 | $7,878,394 | $713,863 | 82,405 | $7,520,285 | $355,754 | 73,772 | $6,732,445 | -$432,085 | -$787,839 | |
| 28 | 1 | 3 | 22 | 69,013 | $6,300,197 | 75,914 | $6,927,939 | $627,742 | 72,464 | $6,613,033 | $312,836 | 64,872 | $5,920,239 | -$379,958 | -$692,794 | |
| Total | 37 | 147,494 | $13,464,727 | 162,243 | $14,806,333 | $1,341,605 | 154,869 | $14,133,318 | $668,590 | 138,644 | $12,652,684 | -$812,043 | -$1,480,633 |
Appendix D
Muni's December 2001 Request for Information on Capital Costs of Building a CNG Fueling Facility
And
Responses to the Request for Information
Note: Appendix D is available only as a PDF file (645kb). If you need an accessible version of this information, please contact Sara Procacci, 415-934-3952, or email: Sara_Procacci@ci.sf.ca.us
Appendix E
Comments to Proposed Revisions to TFCA Funding
And
Response from Bay Area Air Quality Management District
Note: Appendix E is available only
as a PDF file (164kb). If you need an accessible version of this information,
please contact Sara Procacci, 415-934-3952, or email: Sara_Procacci@ci.sf.ca.us
![]()
©2003 San Francisco Municipal Railway. All Rights Reserved.
Page last updated December 8, 2003.
Information last updated May 16, 2002.
FOOTNOTES:
[1] TA Resolution 01-08 authorized $4,156,000 in Proposition B funds to be used as matching funds for the purchase of 95 new Neoplan diesel coaches. The 11-Point Agreement was never specifically mentioned in the resolution.
[2] Islais Creek is the future site of a fueling and maintenance facility for 165 diesel coaches. Currently, construction of that diesel facility at Islais Creek faces a $15 million funding shortfall. If CNG infrastructure were required at Islais Creek, that shortfall would be increased by $4.5M ($8M in costs for CNG fueling and maintenance infrastructure, offset by $3.5M in grant funds for the project=$4.5M) to $19.5M. The $10 million shortfall represents the amount of funding that is required to install fueling and maintenance infrastructure at Islais Creek and a redundant fueling station at Woods.
[3] Staff at Sacramento Regional Transit District provided a rough estimate of costs for a PG&E hookup at approximately $1 million per mile. PG&E officials dispute the $1 million figure, citing a cost of $18,000 that SFO International Airport paid for its hookup.
[4] New Flyer buses will be equipped with a “.10 kit,” which is designed to reduce soot (particulate matter) emissions to one-tenth of a gram per brake horsepower-hour.
[5] The equipment that Muni is using to reduce oxides of nitrogen (NOx) from tailpipe emissions is called exhaust gas recirculation (EGR).
[6] Muni owns 4 Honda Civic sedans that have a range of approximately 80 miles each. Muni also owns 10 CNG forklifts and 4 CNG pushers.
[7] Title 13 California Code of Regulations Sec. 1956.1-1956.4, 1956.8, 1965.
[8] Forty-four out of 71 California transit agencies chose the diesel path. See California Air Resources Board, Transit Bus Fleet Rule Page, http://arbis.arb.ca.gov/msprog/bus/FuelPathSelection103001.PDF.
[9] NOx is “oxides of nitrogen,” which combine with carbon dioxide to form smog.
[10] Muni’s NOx fleet average is already lower due to large number of electric vehicles in fleet. Expected fleet average is 2.84 g/bhp-hr by October 1, 2002, 41% lower than the CARB mandate.
[11] “PM Traps” are filters that sift out soot (particulate matter) from an engine before it is released into the air. In western states, diesel trucks are the main sources of PM.
[12] Under the 11-point agreement, Muni planned to install PM traps by December 2002. Muni has aggressively sought funding for its accelerated retrofit program, but faces a $2 million shortfall.
[13]The chassis dynamometer facility which measured these emissions, calculated them in grams-per-mile, not grams-per –brake horsepower-hour. (CARB also uses the g/mi measurement in calculating NOx fleet averages.) However, engine manufacturers certify engine emissions in measurements of g/bhp-hr. Thus, it is necessary to convert results from g/MI to g//bhp-hr in order to compare the emissions that an engine manufacturer certifies to actual emissions. The g/bhp-hr figures are based on a conversion factor from g/mile. This conversion factor is helpful only in the sense that it provides rough estimates. Both diesel and CNG technologies seem to show NOx above engine certification values while in use. The actual numbers as reported by the chassis dyno facility were roughly 32 g/mile NOx for the diesel. By comparison, the CNG bus emitted roughly 20 g/MI NOx.
[14] Procurement and operational issues delayed the start of the AFPP. With the consent of the Independent Oversight Committee, Muni and the Institute for Transportation Studies at UC Davis began their evaluation in October 2001 and concluded Phase One in March 2002.
[15] The heavy-duty chassis dynamometer in Richmond, CA. is one of five such facilities in North America.
[16] The Hyde Street cable car line has Muni’s most extreme grade at 21%. Motor coaches are expected to operate on this line if cable car operation is not possible.
[17] Faster and slower running times impact operating costs. For example, a bus that runs on hilly lines (19, 23, 29, 44,48,and 54 lines) and completes its run time 6% faster than scheduled saves $3.2 million annually compared to a bus that runs 5% slower on those same lines. A bus that runs 6% faster on flat lines (2, 17, 23, 28, 47, and 88 lines) saves $2.3 million annually compared to a bus that runs 5% slower on those same lines. A detailed analysis of operating costs is available at Appendix __.
[18] This data is consistent with testing undertaken by the Sacramento Regional Transit District.
[19] Muni will be testing the effects of exhaust gas recirculation (EGR) equipment on emissions and fuel economy on 15 of its conventional diesel buses, in 2002-03. The Bay Area Air Quality Management District (BAAQMD) recently awarded Muni a grant to test the efficacy of NOx reduction equipment (EGRs) and PM traps on 15 Muni buses.
[20] Survey results are based on a very limited sample of 18 surveys and follow up discussions with passengers.
[21] All service reliability statistics are based on the first 6 months that all buses were in service at Muni, regardless of the model year of the bus. Muni did not compare the service reliability of new 2001 buses to broken-in 1999 buses. Instead, Muni used service reliability data for the 1999 NABI conventional diesels, based on records from their initial 6 months in service with Muni.
[22] Fuel evaluations were made by converting natural gas into its diesel gallon energy equivalent.
[23] Technology specific maintenance is defined as any maintenance activity pertaining to the propulsion and fuel systems of the vehicles, as well as any other subsystem associated with these areas.
[24] Muni paid approximately $320,000 for each of its newest Neoplan coaches. PM filters cost approximately $10,000 each.
[25] The BAAQMD recently approve a grant for $514,000 for Muni to test EGR technology on 15 of its conventional diesel buses.
[26] Source: John Haake, Southwest Regional Sales Manager of Orion Bus Industries, 707-838-8352. Mr. Haake also stated that with larger quantities or when production becomes standard the pricing should be between $385,000-425,000.
[27] The Regional account funds alternative fuel vehicles but not infrastructure.
[28] Boston and Cleveland have similar concerns with CNG buses passing under overhead trolley wires. In those cities, the probability of a hazardous event occurring on a system that is working within design specifications has been assessed as “4C” by the US Department of Transportation Federal Transit Administration’s Office of Safety and Security rating on mil-std-992D, using standard hazard assessment evaluation techniques.
[29] For example, the large gasoline fuel tanker trucks that one can find throughout San Francisco have greater potential as a target. It should also be noted that New York’s CNG buses still operate daily, but security for all facilities has been increased.
[30] New York City tested CNG buses on its streets for two years before deciding to invest in the technology.
[31] Muni’s tested vehicles for only six months. Similar tests in New York City were conducted in excess of two years before a procurement decision was made. New York is currently purchasing CNG and hybrid buses.
[32] A retrofit is generally estimated to cost 50% more than a new facility.
[33] Mr. Steven Kisbey of the Sacramento Regional Transit District provided information on CNG infrastructure at SRTD.
[34] Muni applied for $10 million for Bus and Bus Facility upgrades in FY02 Congressional Appropriations, a very competitive process. The original $10 million request was for PM retrofits, facility conversion, and a central control facility. However, the net appropriation of approximately $4 million was awarded for “bus and bus facilities.” The appropriations did not specify how the $4 million should be allocated. Muni’s Capital Planning and Grants staff has allocated $2.5 million of the $4 million earmark as a placeholder. If Muni does not use the $2.5 million for CNG facilities, Muni may use it for PM traps, a central control facility, and/or any other bus and bus facility upgrades.
[35] The only identified workaround for a small fleet is to degas each coach before towing into a standard maintenance bay.
[36] Mr. Stephen Kisbey of the Sacramento Regional Transit District provided information on CNG infrastructure at SRTD.
[37] Unlike most transit agencies that operate their CNG bus and electric vehicles on separate corridors, many of Muni’s diesel and electric buses run under the same wire. The proximity of a roof-mounted CNG tank to overhead wire may pose safety concerns. Wire height in the city varies between 14 feet under some overpasses and 22 feet in extreme road dips.
[38] The South Coast Air Quality Management District conducted outreach with neighbors of an Omnitrans CNG facility who were concerned about the odor of methyl mercaptan. http://www.omnitrans.org/html/odor_faq.html#Q1 (archived at http://web.archive.org/web/20030303212008/http://www.omnitrans.org/html/odor_faq.html#Q1 )
[39] SB 1927, introduced February 22, 2002.
[40] Copies of Muni’s suggestions for changing Air District guidelines and the Air District’s response are attached in Appendix D.
[41] As of March 19, 2002, 95 out of the 120 buses in the active fleet that are older than 1992 have been rebuilt with a .”10 rebuild kit” that reduces PM emissions to .10 g/bhp-hr.
![]() 311 Free language assistance / 免費語言協助 / Ayuda gratuita con el idioma / Бесплатная помощь переводчиков / Trợ giúp Thông dịch Miễn phí / Assistance linguistique gratuite / 無料の言語支援 / 무료 언어 지원 / Libreng tulong para sa wikang Tagalog / คว“มช่วยเหลือท“งภ“ษ“โดยไม่เส’ยค่าใช้จ่าย
311 Free language assistance / 免費語言協助 / Ayuda gratuita con el idioma / Бесплатная помощь переводчиков / Trợ giúp Thông dịch Miễn phí / Assistance linguistique gratuite / 無料の言語支援 / 무료 언어 지원 / Libreng tulong para sa wikang Tagalog / คว“มช่วยเหลือท“งภ“ษ“โดยไม่เส’ยค่าใช้จ่าย
©2000-2013 San Francisco Municipal Transportation Agency. All rights reserved.
